. 2014 Sep;134(9):2321-2330.
doi: 10.1038/jid.2014.69. Epub 2014 Feb 4.

Altered MCM protein levels and autophagic flux in aged and systemic sclerosis dermal fibroblasts

Affiliations

Altered MCM protein levels and autophagic flux in aged and systemic sclerosis dermal fibroblasts

Verónica I Dumit et al. J Invest Dermatol. 2014 Sep.

Abstract

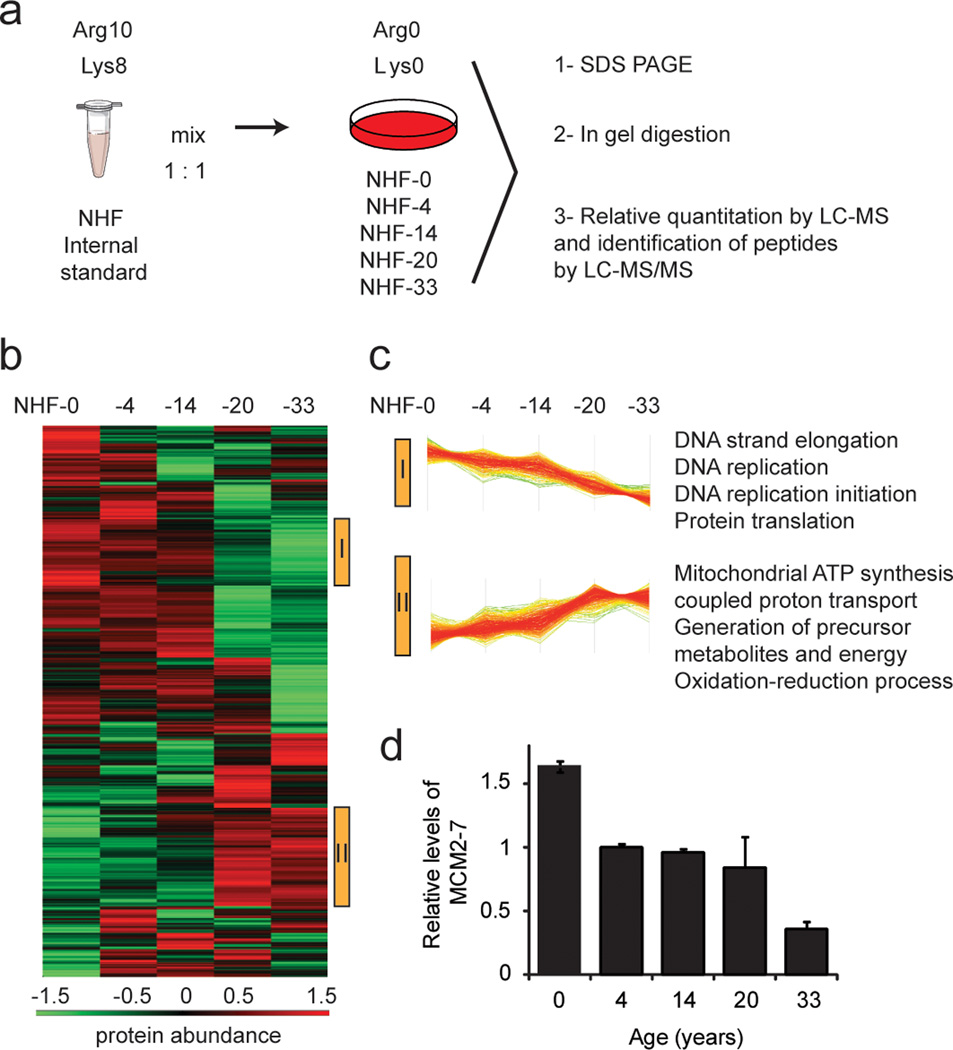
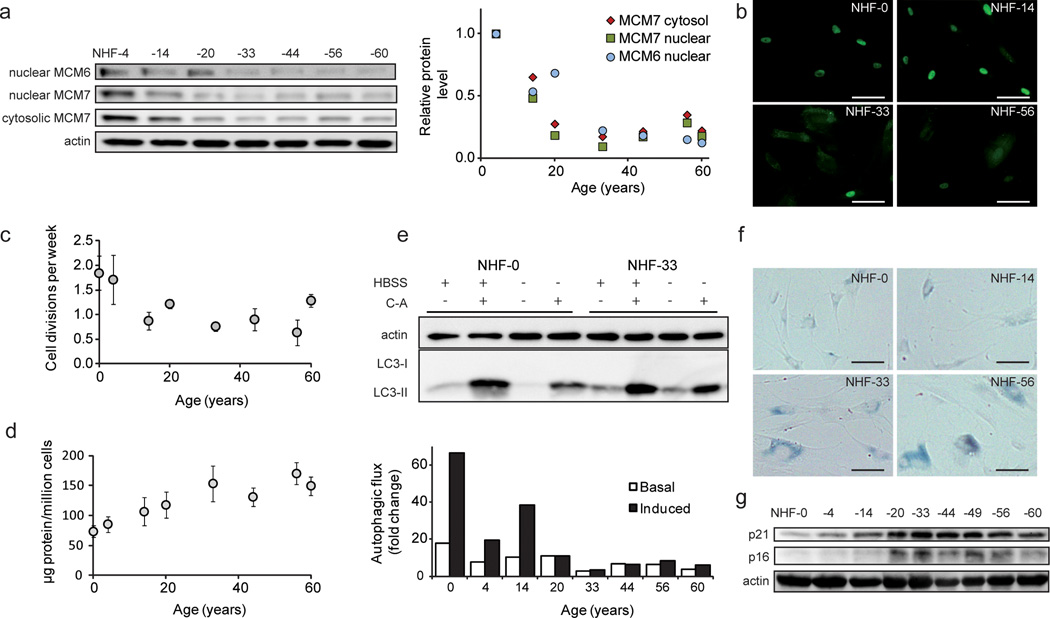
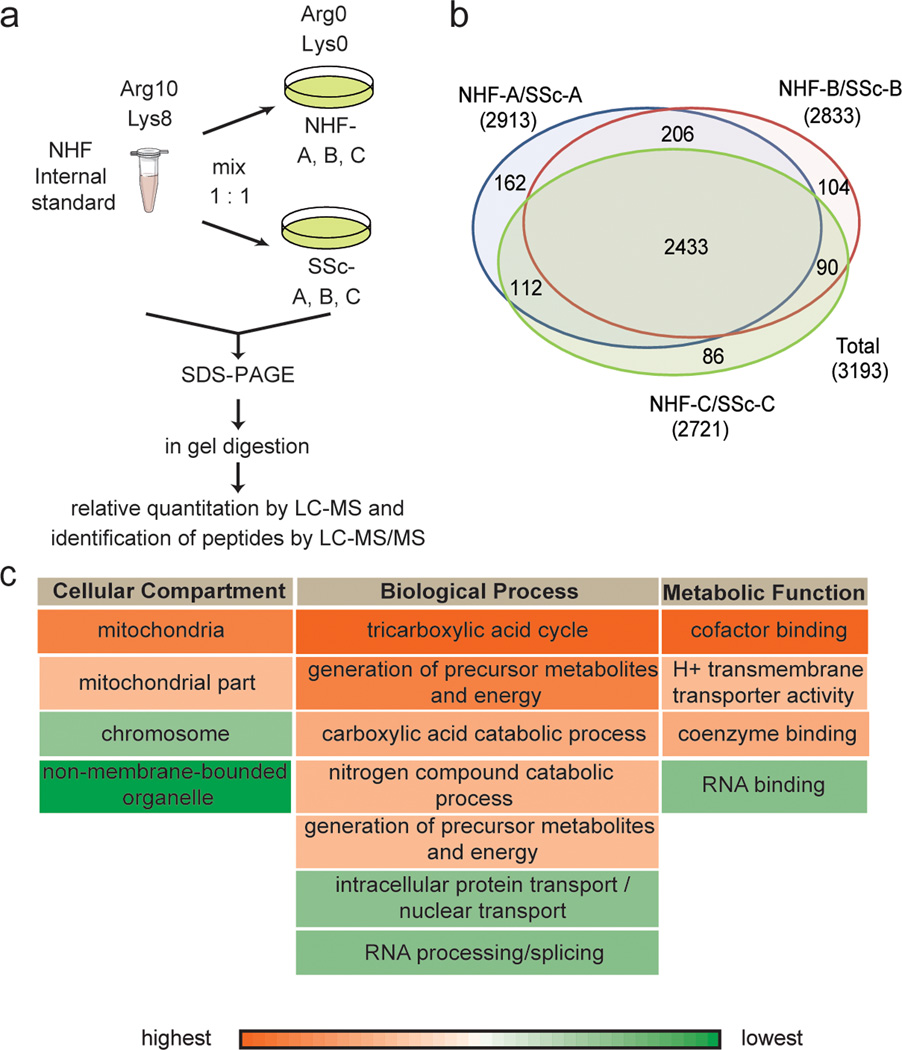
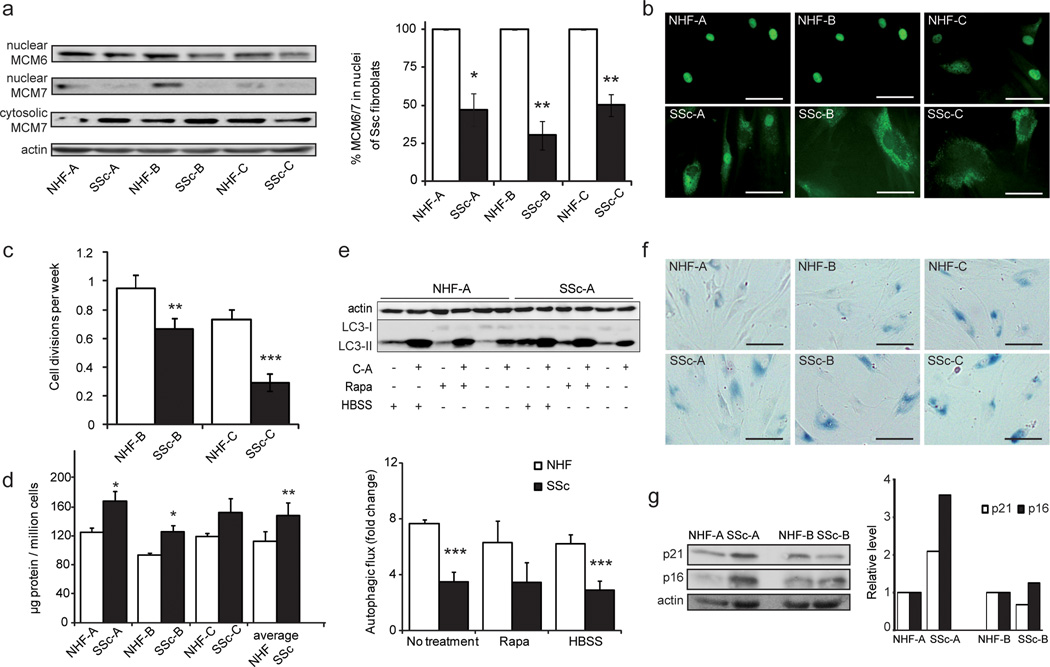
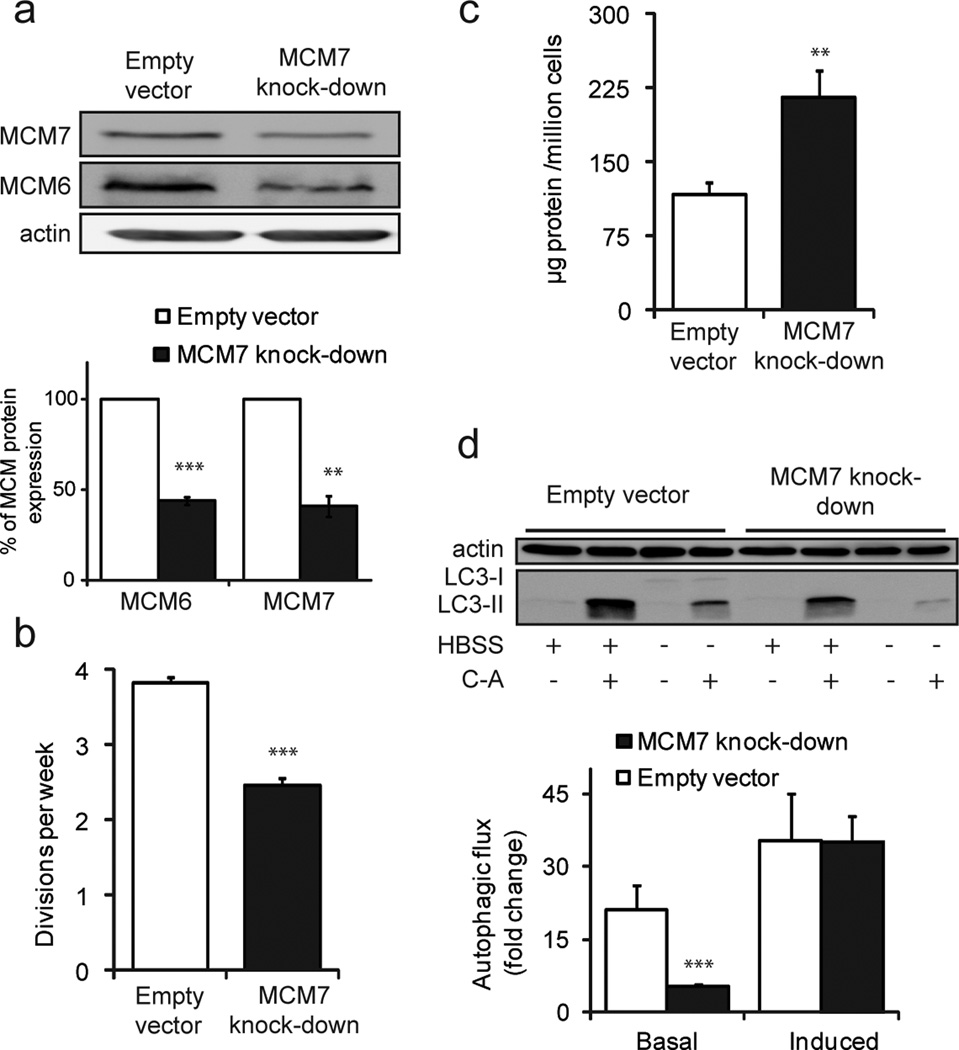
Aging is a common risk factor of many disorders. With age, the level of insoluble extracellular matrix increases leading to increased stiffness of a number of tissues. Matrix accumulation can also be observed in fibrotic disorders, such as systemic sclerosis (SSc). Although the intrinsic aging process in skin is phenotypically distinct from SSc, here we demonstrate similar behavior of aged and SSc skin fibroblasts in culture. We have used quantitative proteomics to characterize the phenotype of dermal fibroblasts from healthy subjects of various ages and from patients with SSc. Our results demonstrate that proteins involved in DNA and RNA processing decrease with age and in SSc, whereas those involved in mitochondrial and other metabolic processes behave the opposite. Specifically, minichromosome maintenance (MCM) helicase proteins are less abundant with age and SSc, and they exhibit an altered subcellular distribution. We observed that lower levels of MCM7 correlate with reduced cell proliferation, lower autophagic capacity, and higher intracellular protein abundance phenotypes of aged and SSc cells. In addition, we show that SSc fibroblasts exhibit higher levels of senescence compared with their healthy counterparts, suggesting further similarities between the fibrotic disorder and the aging process. Hence, at the molecular level, SSc fibroblasts exhibit intrinsic characteristics of fibroblasts from aged skin.


Conflict of interest statement

Conflict of Interest

The authors declare that there are no conflicts of interest.

Figures

Figure 1
Figure 1. Proteomics analysis of skin fibroblasts from donors of different ages: 0, 4, 14, 20 and 33 years
(a) Work-flow followed to investigate proteome changes of fibroblasts. A “heavy” (Arg10, Lys8) labeled primary human fibroblast standard was spiked in 1:1 ratios to “light” (Arg0, Lys0) labeled samples. Lysates were separated by SDS-PAGE, proteins were digested by trypsin in gel, and the resulting peptide mixtures were analyzed by reversed-phase LC-MS/MS. (b) Hierarchical clustering of protein ratios. Samples were ordered according to the age of the donors. Protein ratios were log2 transformed and z score normalized prior to hierarchical clustering. Two clusters were identified with proteins that consistently decreased (cluster I) or increased (cluster II) with age, which are marked by yellow bars on the right side of the heat map. Bottom: color scale indicates relative protein abundance values. (c) Line diagrams of identified clusters, each line representing one protein. GO terms of proteins enriched more than 1.5 fold in the highlighted clusters are explicitly mentioned (p<0.05). (d) Average relative levels of MCM complex proteins (MCM2-MCM7), as quantified by MS. Primary cells were compared to internal standard. Error bars indicate S.E.M. of all protein complex members (n = 5).
Figure 2
Figure 2. Phenotype of skin fibroblasts from donors of varying ages
(a) Relative levels of MCM6 and MCM7 as detected by Western blot. Samples were normalized to protein amount, and actin is shown as loading control. The diagram shows quantitation relative to NHF-4. (b) Microscopy pictures of MCM7 immunostaining of cells of different ages. Scale bars = 100 µm. (c) Proliferation rates, calculated as cell divisions per week (n = 3). (d) Total protein concentration in whole cell lysates. (e) Analysis of autophagic fluxes under amino acid starvation (induced) and control conditions (basal). LC3-II levels of samples treated with and without concanamycin A (C-A) were quantified and normalized to actin. A representative Western blot is depicted (see Supplementary Figure 3 for further analyses). Fibroblasts exhibit increased senescence with age, as detected by (f) β-galactosidase activity, and (g) p16 and p21 levels.
Figure 3
Figure 3. Proteomics analysis of SSc fibroblasts by MS
(a) Work-flow followed to compare proteomes of SSc and control fibroblasts. Fully labeled control NHF were used as an internal standard to combine abundance values. (b) Venn Diagram represents the number of detected proteins in each experiment (two biological replicates each). (c) Selected GO terms of significantly altered proteins in SSc fibroblasts as detected by DAVID are shown (p<0.05). Red highlights up-regulated and green down-regulated protein abundance.
Figure 4
Figure 4. Molecular phenotype of SSc affected fibroblasts
(a) Levels of MCM6 and MCM7 in nuclear fractions, as detected by Western blot, are shown. Bar diagram represents quantification of nuclear MCM6 and MCM7 by Western blot analysis. Samples were normalized to protein content, and actin is shown as loading control. (b) Microscopy pictures of MCM7 immunostaining indicate a change in subcellular localization. (c) Proliferation rates, calculated as cell divisions per week of two matching pairs, are highlighted. (d) Protein concentration in whole cell lysate is depicted. (e) Autophagic fluxes under amino acid starvation, rapamycin treatment and control conditions are shown (see Figure 2; * = P < 0.05; ** = P < 0.01; *** = P < 0.001). A representative Western blot is depicted (see Supplementary Figure 7 for further analyses). Senescence levels in SSc and control fibroblasts as detected by (f) β-galactosidase activity, and (g) p16 and p21 levels.
Figure 5
Figure 5. Behavior of MCM7 knock-down fibroblasts
(a) Abundance of MCM proteins in whole cell lysate of MCM7 knock-down and mock treated control fibroblasts. Bar diagram depicts protein ratios normalized to actin. (b) Proliferation rates calculated as cell divisions per week. (c) Protein concentration in whole cell lysate. (d) Autophagic fluxes under amino acid starvation (induced) and control conditions (basal) (see Figure 2; ** = P < 0.01; *** = P < 0.001).

Comment in

  • Proteomic revelations.
    Davidson JM. Davidson JM. J Invest Dermatol. 2014 Sep;134(9):2301-2302. doi: 10.1038/jid.2014.242. J Invest Dermatol. 2014. PMID: 25120144 Free PMC article.

References

    1. Akimov V, Rigbolt KT, Nielsen MM, et al. Characterization of ubiquitination dependent dynamics in growth factor receptor signaling by quantitative proteomics. Mol Biosyst. 2011;7:3223–3233. - PubMed
    1. Bellot G, Garcia-Medina R, Gounon P, et al. Hypoxia-induced autophagy is mediated through hypoxia-inducible factor induction of BNIP3 and BNIP3L via their BH3 domains. Mol Cell Biol. 2009;29:2570–2581. - PMC - PubMed
    1. Castello-Cros R, Whitaker-Menezes D, Molchansky A, et al. Scleroderma-like properties of skin from caveolin-1-deficient mice: implications for new treatment strategies in patients with fibrosis and systemic sclerosis. Cell Cycle. 2011;10:2140–2150. - PMC - PubMed
    1. Chen F, Wang CC, Kim E, Harrison LE. Hyperthermia in combination with oxidative stress induces autophagic cell death in HT-29 colon cancer cells. Cell Biol Int. 2008;32:715–723. - PubMed
    1. Choi AM, Ryter SW, Levine B. Autophagy in human health and disease. N Engl J Med. 2013;368:651–662. - PubMed

Publication types

MeSH terms

Substances