

Implementation of statistical process control for proteomic experiments via LC MS/MS
- PMID: 24496601
- PMCID: PMC4020592
- DOI: 10.1007/s13361-013-0824-5
Implementation of statistical process control for proteomic experiments via LC MS/MS
Abstract
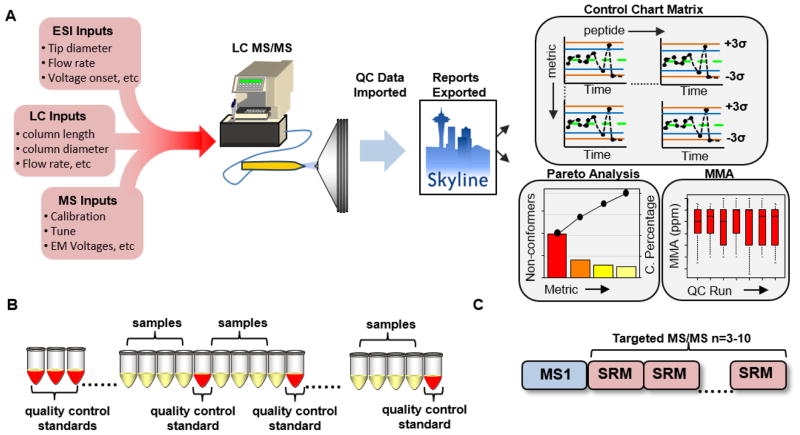
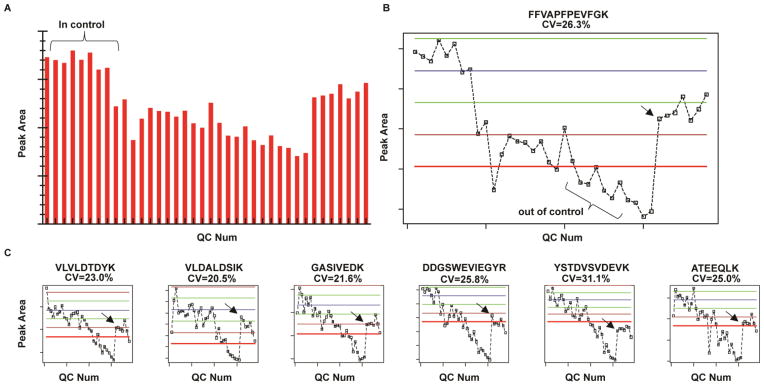
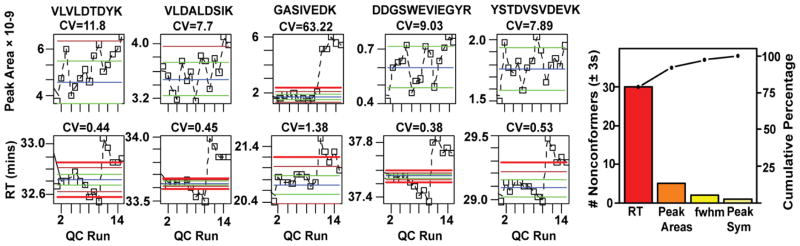
Statistical process control (SPC) is a robust set of tools that aids in the visualization, detection, and identification of assignable causes of variation in any process that creates products, services, or information. A tool has been developed termed Statistical Process Control in Proteomics (SProCoP) which implements aspects of SPC (e.g., control charts and Pareto analysis) into the Skyline proteomics software. It monitors five quality control metrics in a shotgun or targeted proteomic workflow. None of these metrics require peptide identification. The source code, written in the R statistical language, runs directly from the Skyline interface, which supports the use of raw data files from several of the mass spectrometry vendors. It provides real time evaluation of the chromatographic performance (e.g., retention time reproducibility, peak asymmetry, and resolution), and mass spectrometric performance (targeted peptide ion intensity and mass measurement accuracy for high resolving power instruments) via control charts. Thresholds are experiment- and instrument-specific and are determined empirically from user-defined quality control standards that enable the separation of random noise and systematic error. Finally, Pareto analysis provides a summary of performance metrics and guides the user to metrics with high variance. The utility of these charts to evaluate proteomic experiments is illustrated in two case studies.
Figures
Similar articles
-
An Automated Pipeline to Monitor System Performance in Liquid Chromatography-Tandem Mass Spectrometry Proteomic Experiments.J Proteome Res. 2016 Dec 2;15(12):4763-4769. doi: 10.1021/acs.jproteome.6b00744. Epub 2016 Oct 4. J Proteome Res. 2016. PMID: 27700092 Free PMC article.
-
Tools for monitoring system suitability in LC MS/MS centric proteomic experiments.Proteomics. 2015 Mar;15(5-6):891-902. doi: 10.1002/pmic.201400373. Epub 2014 Dec 23. Proteomics. 2015. PMID: 25327420 Review.
-
Reagent for Evaluating Liquid Chromatography-Tandem Mass Spectrometry (LC-MS/MS) Performance in Bottom-Up Proteomic Experiments.Anal Chem. 2015 Dec 1;87(23):11635-40. doi: 10.1021/acs.analchem.5b04121. Epub 2015 Nov 10. Anal Chem. 2015. PMID: 26537636
-
Statistical Assessment of QC Metrics on Raw LC-MS/MS Data.Methods Mol Biol. 2017;1550:325-337. doi: 10.1007/978-1-4939-6747-6_22. Methods Mol Biol. 2017. PMID: 28188539
-
Applications of peptide retention time in proteomic data analysis.Adv Exp Med Biol. 2015;845:67-75. doi: 10.1007/978-94-017-9523-4_7. Adv Exp Med Biol. 2015. PMID: 25355570 Review.
Cited by
-
Toxicoproteomic analysis of pulmonary carbon nanotube exposure using LC-MS/MS.Toxicology. 2015 Mar 2;329:80-7. doi: 10.1016/j.tox.2015.01.011. Epub 2015 Jan 15. Toxicology. 2015. PMID: 25598225 Free PMC article.
-
Proteogenomic convergence for understanding cancer pathways and networks.Clin Proteomics. 2014 Jun 1;11(1):22. doi: 10.1186/1559-0275-11-22. eCollection 2014. Clin Proteomics. 2014. PMID: 24994965 Free PMC article. Review.
-
Multiplexed, Scheduled, High-Resolution Parallel Reaction Monitoring on a Full Scan QqTOF Instrument with Integrated Data-Dependent and Targeted Mass Spectrometric Workflows.Anal Chem. 2015 Oct 20;87(20):10222-9. doi: 10.1021/acs.analchem.5b02983. Epub 2015 Sep 30. Anal Chem. 2015. PMID: 26398777 Free PMC article.
-
Exposure to BMAA mirrors molecular processes linked to neurodegenerative disease.Proteomics. 2017 Sep;17(17-18):10.1002/pmic.201700161. doi: 10.1002/pmic.201700161. Epub 2017 Aug 24. Proteomics. 2017. PMID: 28837265 Free PMC article.
-
Methods for Proteomic Analyses of Mycobacteria.Methods Mol Biol. 2021;2314:533-548. doi: 10.1007/978-1-0716-1460-0_23. Methods Mol Biol. 2021. PMID: 34235669
References
-
- Hu QZ, Noll RJ, Li HY, Makarov A, Hardman M, Cooks RG. The Orbitrap: a new mass spectrometer. J Mass Spectrom. 2005;40:430–443. - PubMed
Publication types
MeSH terms
Substances
Grants and funding
LinkOut - more resources
Full Text Sources
Other Literature Sources
