. 2014 Feb;141(4):909-17.
doi: 10.1242/dev.103093.

TGFβ regulates epithelial-mesenchymal interactions through WNT signaling activity to control muscle development in the soft palate

Affiliations

TGFβ regulates epithelial-mesenchymal interactions through WNT signaling activity to control muscle development in the soft palate

Jun-ichi Iwata et al. Development. 2014 Feb.

Abstract

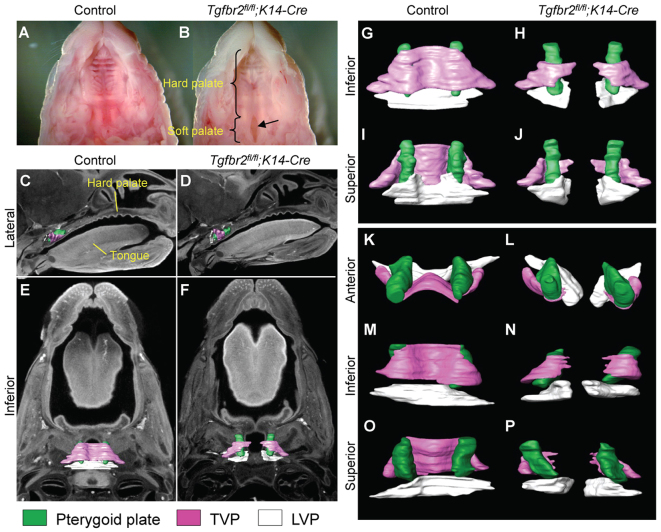
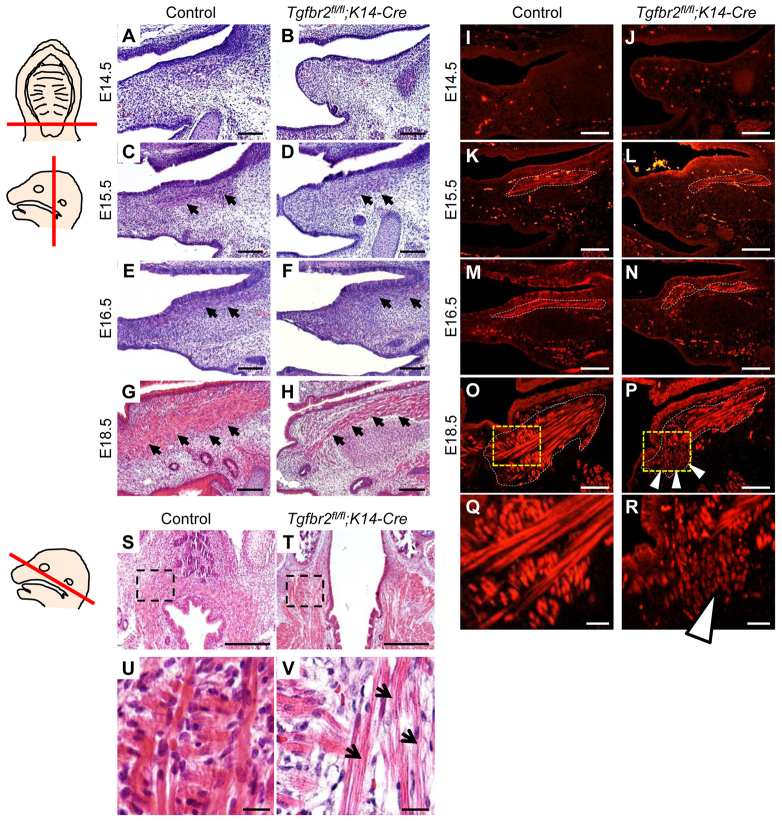
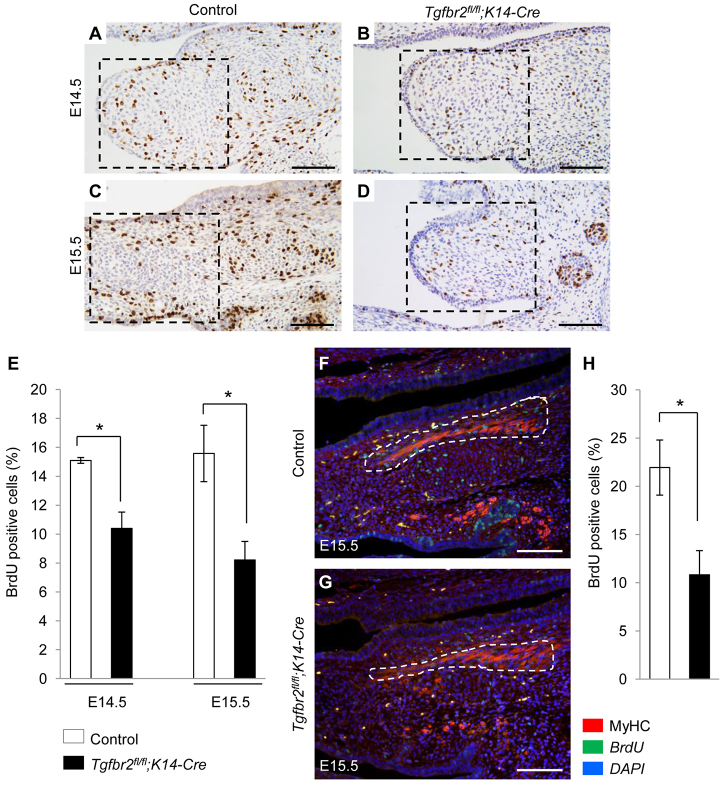
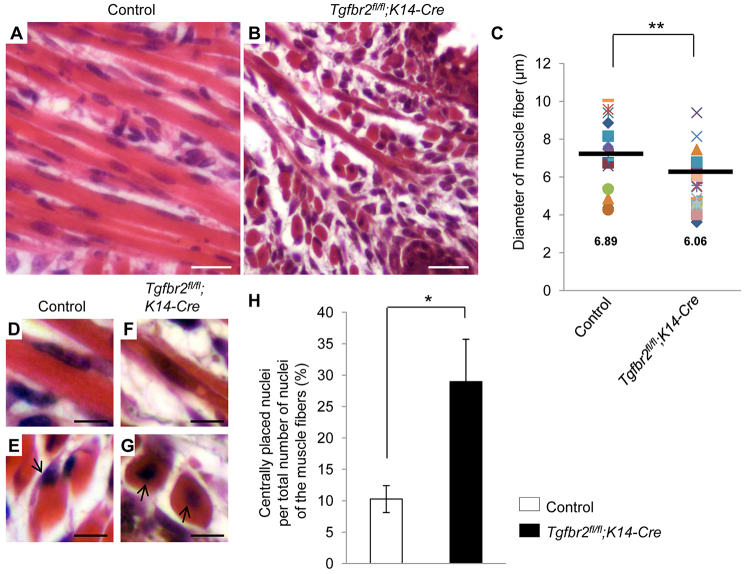
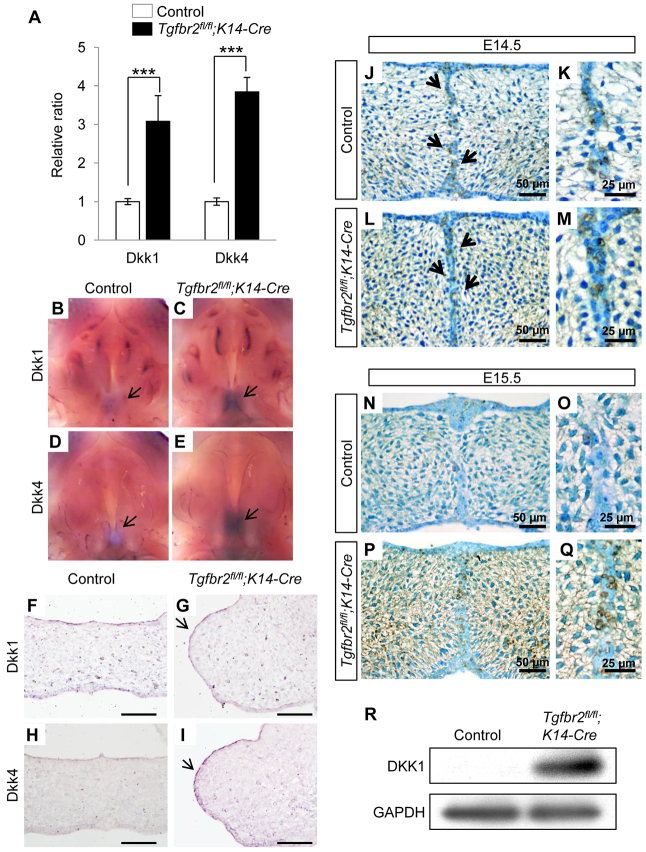
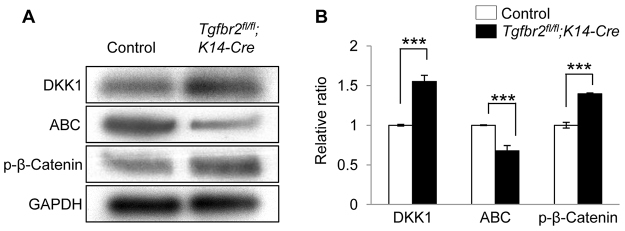
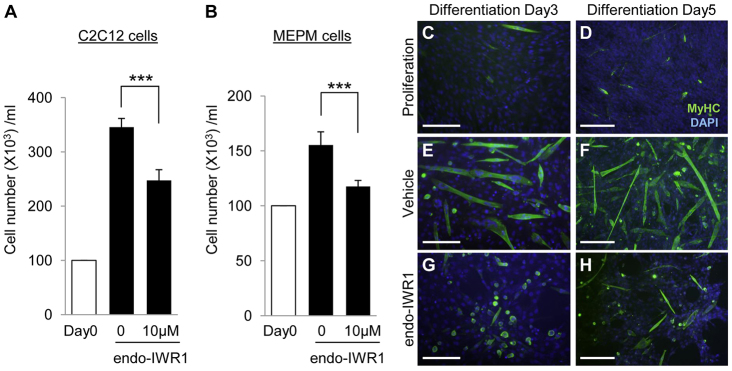
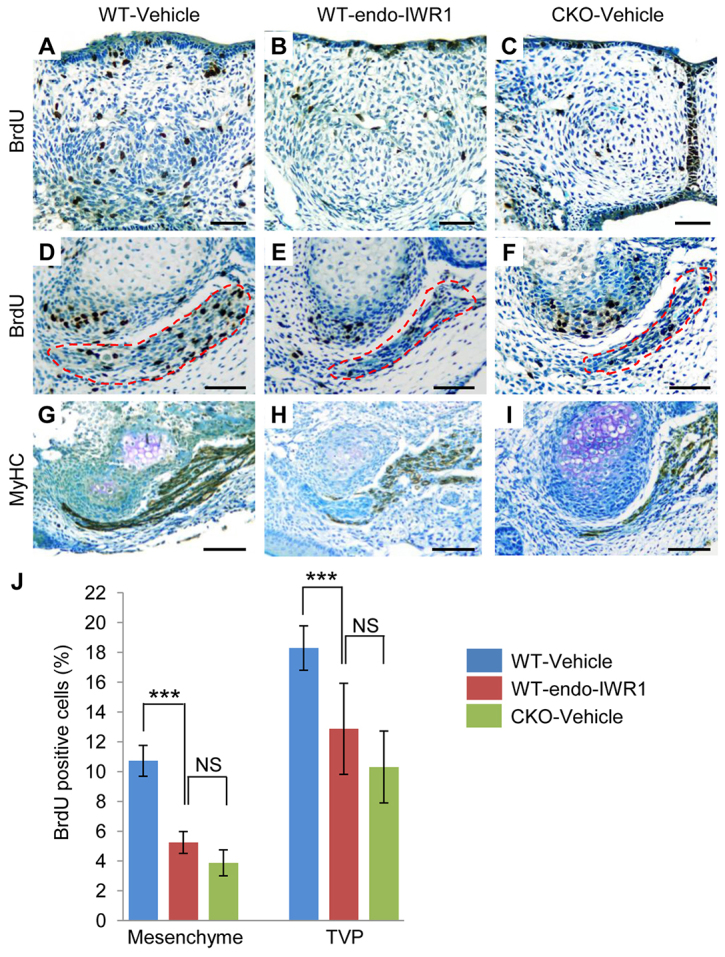
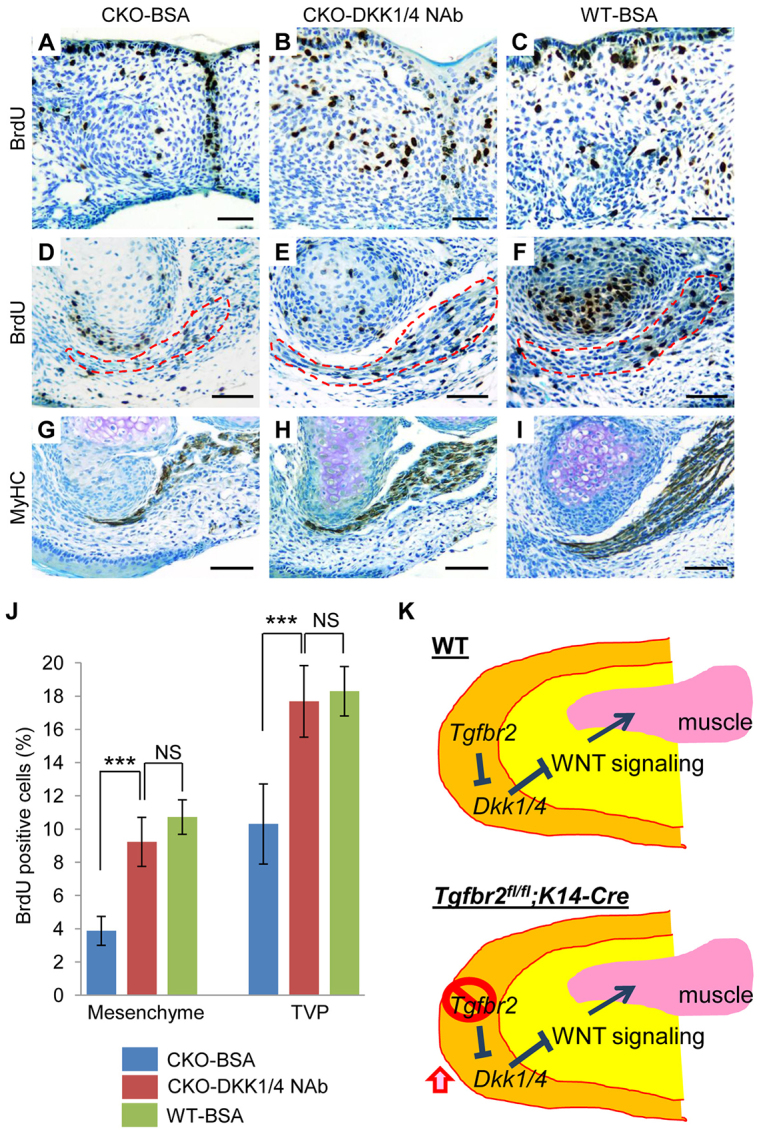
Clefting of the soft palate occurs as a congenital defect in humans and adversely affects the physiological function of the palate. However, the molecular and cellular mechanism of clefting of the soft palate remains unclear because few animal models exhibit an isolated cleft in the soft palate. Using three-dimensional microCT images and histological reconstruction, we found that loss of TGFβ signaling in the palatal epithelium led to soft palate muscle defects in Tgfbr2(fl/fl);K14-Cre mice. Specifically, muscle mass was decreased in the soft palates of Tgfbr2 mutant mice, following defects in cell proliferation and differentiation. Gene expression of Dickkopf (Dkk1 and Dkk4), negative regulators of WNT-β-catenin signaling, is upregulated in the soft palate of Tgfbr2(fl/fl);K14-Cre mice, and WNT-β-catenin signaling is disrupted in the palatal mesenchyme. Importantly, blocking the function of DKK1 and DKK4 rescued the cell proliferation and differentiation defects in the soft palate of Tgfbr2(fl/fl);K14-Cre mice. Thus, our findings indicate that loss of TGFβ signaling in epithelial cells compromises activation of WNT signaling and proper muscle development in the soft palate through tissue-tissue interactions, resulting in a cleft soft palate. This information has important implications for prevention and non-surgical correction of cleft soft palate.

Keywords: Cleft soft palate; Epithelial-mesenchymal interactions; Mouse; TGFβ.


Figures

Fig. 1.
Fig. 1.
Epithelial-specific loss of Tgfbr2 in mice results in muscle mass reduction and cleft soft palate. (A,B) Macroscopic appearance of palates of newborn Tgfbr2fl/fl control and Tgfbr2fl/fl;K14-Cre mice. Arrow indicates cleft soft palate. (C-J) 3D reconstruction of palates from microCT images of E18.5 Tgfbr2fl/fl control (C,E,G,I) and Tgfbr2fl/fl;K14-Cre mice (D,F,H,J). Pterygoid plate (green); TVP (tensor veli palatini, pink); LVP (levator veli palatini, white). (K-P) 3D reconstruction of palates from histological sections of E18.5 Tgfbr2fl/fl control (K,M,O) and Tgfbr2fl/fl;K14-Cre mice (L,N,P). Pterygoid plate (green); TVP (pink); LVP (white).
Fig. 2.
Fig. 2.
Reduction of muscle mass in Tgfbr2fl/fl;K14-Cre mice. (A-H) H&E staining of Tgfbr2fl/fl control (A,C,E,G) and Tgfbr2fl/fl;K14-Cre (B,D,F,H) mice at the indicated developmental stages. Red lines on the schematic drawings on the left show the position of the sections. Arrows indicate the LVP. Scale bars: 100 μm. (I-R) Immunohistochemical staining of myosin heavy chain (MyHC) in the soft palate of Tgfbr2fl/fl control (I,K,M,O,Q) and Tgfbr2fl/fl;K14-Cre (J,L,N,P,R) mice at the indicated developmental stages. Dotted lines indicate outline of the LVP. Arrowheads indicate altered orientation of muscle fibers. Boxed areas in O and P are enlarged in Q and R, respectively. Scale bars: 100 μm (I-P); 25 μm (Q,R). (S-V) H&E staining of E18.5 Tgfbr2fl/fl control (S,U) and Tgfbr2fl/fl;K14-Cre (T,V) mice. Boxed areas in S and T are enlarged in U and V, respectively. Red line on the schematic on the left indicates the position of the sections. Arrows indicate muscle atrophy. Scale bars: 100 μm (S,T); 10 μm (U,V).
Fig. 3.
Fig. 3.
Cell proliferation defect in the soft palate of Tgfbr2fl/fl;K14-Cre mice. (A-D) BrdU staining (brown) of Tgfbr2fl/fl control (A,C) and Tgfbr2fl/fl;K14-Cre (B,D) mice at E14.5 and E15.5. Scale bars: 100 μm. (E) Quantification of the number of BrdU-labeled nuclei in the palates of Tgfbr2fl/fl control (white bars) and Tgfbr2fl/fl;K14-Cre (black bars) mice at E14.5 and E15.5. Three samples per genotype were analyzed. *P<0.05; n=3. (F-H) Immunofluorescence images of BrdU (green) and MyHC (red) staining in the LVP of Tgfbr2fl/fl control (F) and Tgfbr2fl/fl;K14-Cre (G) mice at E15.5. Nuclei were counterstained with DAPI (blue). The number of BrdU-labeled nuclei is quantified in H. Three samples per genotype were analyzed. *P<0.05. Dotted lines indicate outline of the LVP. Scale bars: 100 μm.
Fig. 4.
Fig. 4.
Altered differentiation of myogenic cells in Tgfbr2fl/fl;K14-Cre mice. (A,B) H&E staining of LVP from E18.5 Tgfbr2fl/fl control (A) and Tgfbr2fl/fl;K14-Cre (B) mice. Scale bars: 20 μm. (C) Quantification of the diameter of muscle fibers in the palates of E18.5 control and Tgfbr2fl/fl;K14-Cre mice. Horizontal bars indicate the mean (stated below). **P<0.01; n=6. (D-G) Representative high magnification images of centrally placed nuclei in the longitudinal (D,F) or coronal (E,G) directions in A and B. Arrows indicate nuclei. Scale bars: 10 μm. (H) Quantification of the number of centrally placed nuclei out of the total number of nuclei in the muscle fibers of E18.5 control (white bar) and Tgfbr2fl/fl;K14-Cre (black bar) palates. Three samples per genotype were analyzed. *P<0.05.
Fig. 5.
Fig. 5.
Identification of molecules altered in the soft palate of Tgfbr2fl/fl;K14-Cre mice. (A) Quantitative RT-PCR analyses of the Dkk1 and Dkk4 genes in the soft palates of E15.5 Tgfbr2fl/fl control (white bars) and Tgfbr2fl/fl;K14-Cre (black bars) mice. Three samples were analyzed for each experiment. ***P<0.001. (B-E) Whole-mount in situ hybridization for Dkk1 (B,C) and Dkk4 (D,E) in E14.0 Tgfbr2fl/fl control (B,D) and Tgfbr2fl/fl;K14-Cre (C,E) palates. Arrows indicate positive signals (purple). (F-I) Section in situ hybridization for Dkk1 (F,G) and Dkk4 (H,I) in E15.5 Tgfbr2fl/fl control (F,H) and Tgfbr2fl/fl;K14-Cre (G,I) mice. Arrows indicate positive signals (purple). Scale bars: 100 μm. (J-Q) Immunohistochemical analysis for DKK1 in Tgfbr2fl/fl control (J,K,N,O) and Tgfbr2fl/fl;K14-Cre (L,M,P,Q) palates at E14.5 (J-M) and E15.5 (N-Q). Arrows indicate positive signals (brown). High magnification images from J,L,N,P are shown in K,M,O,Q, respectively. Scale bars: 50 μm in J,L,N,P; 25 μm in K,M,O,Q. (R) Immunoblotting analysis of DKK1 in palatal mesenchyme of E15.5 Tgfbr2fl/fl (control) and Tgfbr2fl/fl;K14-Cre soft palate. GAPDH was used as a loading control.
Fig. 6.
Fig. 6.
Compromised WNT-β-catenin signaling activity in the soft palate of Tgfbr2fl/fl;K14-Cre mice. (A,B) Immunoblotting analysis of DKK1, active form of β-catenin (ABC), and phosphorylated β-catenin (p-β-Catenin) in the entire soft palate of E15.5 Tgfbr2fl/fl (control) and Tgfbr2fl/fl;K14-Cre mice. GAPDH was used as a loading control. Bar graph (B) shows the ratio of DKK1, ABC and p-β-catenin per GAPDH following quantitative densitometry analyses of immunoblots. White bars, Tgfbr2fl/fl control; black bars, Tgfbr2fl/fl;K14-Cre. Three samples per genotype were analyzed. ***P<0.001.
Fig. 7.
Fig. 7.
Inhibition of WNT-signaling-compromised cell proliferation and differentiation activities. (A,B) Cell proliferation assays of C2C12 (A) and MEPM (B) cells after treatment with endo-IWR1 at 0 or 10 μM for 24 hours. ***P<0.001; n=6. (C-H) MyHC staining (green) with DAPI (blue) after treatment with vehicle or endo-IWR1 for the indicated number of days. Scale bars: 100 μm (C,E,G); 200 μm (D,F,H).
Fig. 8.
Fig. 8.
Inhibition of WNT signaling causes cell proliferation and muscle differentiation defects in palatal explants. (A-C) BrdU staining after treatment with vehicle or endo-IWR1 for 1 day in palatal explants from wild-type mice (A,B) or treatment with vehicle in Tgfbr2fl/fl;K14-Cre mice (C). Scale bars: 50 μm. (D-I) BrdU (D-F) and MyHC staining (G-I) after treatment with vehicle (D,G) or endo-IWR1 (E,H) for 3 days in palatal explants from wild-type mice (D,E,G,H) or treatment with vehicle in palatal explants from Tgfbr2fl/fl;K14-Cre mice (F,I). Dotted lines indicate the outline of the TVP. Scale bars: 50 μm. (J) Quantification of the number of BrdU-labeled nuclei after treatment with vehicle (blue bars) or endo-IWR1 (red bars) in the mesenchyme or the TVP of wild-type palatal explants and treatment with vehicle in palatal explants from Tgfbr2fl/fl;K14-Cre mice (green bars). Six samples per group were analyzed. ***P<0.001; NS, not significant.
Fig. 9.
Fig. 9.
Restored cell proliferation and muscle differentiation activities in the soft palate of Tgfbr2fl/fl;K14-Cre mice. (A-C) BrdU staining after treatment with BSA (A) or neutralizing antibody (NAb) for DKK1 and DKK4 (B) for 1 day in Tgfbr2fl/fl;K14-Cre soft palate explants and with BSA in Tgfbr2fl/fl control soft palate explants (C). Scale bars: 50 μm. (D-I) BrdU (D-F) and MyHC staining (G-I) after treatment with BSA (D,G) or NAb for DKK1 and DKK4 (E,H) for 3 days in Tgfbr2fl/fl;K14-Cre palatal explants and with BSA in Tgfbr2fl/fl control palatal explants (F,I). Dotted lines indicate the outline of the TVP. Scale bars: 50 μm. (J) Quantification of the number of BrdU-labeled nuclei after treatment with BSA (blue bars) or DKK1/4 NAb (red bars) in the mesenchyme or the TVP of Tgfbr2fl/fl;K14-Cre palatal explants and treatment with BSA in the wild-type palatal explants (green bars). Six samples per group were analyzed. ***P<0.001; NS, not significant. (K) Schematic depicts our model of the mechanism of soft palate development in wild-type (WT; upper panel) and Tgfbr2fl/fl;K14-Cre mice (lower panel). Loss of Tgfbr2 results in upregulated expression of Dkk1 and Dkk4 and inhibits WNT signaling in the palatal mesenchyme, resulting in muscle defects.

Similar articles

Cited by

References

    1. Back G. W., Nadig S., Uppal S., Coatesworth A. P. (2004). Why do we have a uvula?: literature review and a new theory. Clin. Otolaryngol. Allied Sci. 29, 689–693 - PubMed
    1. Brault V., Moore R., Kutsch S., Ishibashi M., Rowitch D. H., McMahon A. P., Sommer L., Boussadia O., Kemler R. (2001). Inactivation of the beta-catenin gene by Wnt1-Cre-mediated deletion results in dramatic brain malformation and failure of craniofacial development. Development 128, 1253–1264 - PubMed
    1. Bush J. O., Jiang R. (2012). Palatogenesis: morphogenetic and molecular mechanisms of secondary palate development. Development 139, 231–243 - PMC - PubMed
    1. Carvajal Monroy P. L., Grefte S., Kuijpers-Jagtman A. M., Wagener F. A., Von den Hoff J. (2012). Strategies to improve regeneration of the soft palate muscles after cleft palate repair. Tissue Eng. Part B Rev. 18, 468–477 - PMC - PubMed
    1. Chai Y., Maxson R. E., Jr (2006). Recent advances in craniofacial morphogenesis. Dev. Dyn. 235, 2353–2375 - PubMed

Publication types

MeSH terms

Substances