

A subspace approach to high-resolution spectroscopic imaging
- PMID: 24496655
- PMCID: PMC4051394
- DOI: 10.1002/mrm.25168
A subspace approach to high-resolution spectroscopic imaging
Abstract
Purpose: To accelerate spectroscopic imaging using sparse sampling of (k,t)-space and subspace (or low-rank) modeling to enable high-resolution metabolic imaging with good signal-to-noise ratio.
Methods: The proposed method, called SPectroscopic Imaging by exploiting spatiospectral CorrElation, exploits a unique property known as partial separability of spectroscopic signals. This property indicates that high-dimensional spectroscopic signals reside in a very low-dimensional subspace and enables special data acquisition and image reconstruction strategies to be used to obtain high-resolution spatiospectral distributions with good signal-to-noise ratio. More specifically, a hybrid chemical shift imaging/echo-planar spectroscopic imaging pulse sequence is proposed for sparse sampling of (k,t)-space, and a low-rank model-based algorithm is proposed for subspace estimation and image reconstruction from sparse data with the capability to incorporate prior information and field inhomogeneity correction.
Results: The performance of the proposed method has been evaluated using both computer simulations and phantom studies, which produced very encouraging results. For two-dimensional spectroscopic imaging experiments on a metabolite phantom, a factor of 10 acceleration was achieved with a minimal loss in signal-to-noise ratio compared to the long chemical shift imaging experiments and with a significant gain in signal-to-noise ratio compared to the accelerated echo-planar spectroscopic imaging experiments.
Conclusion: The proposed method, SPectroscopic Imaging by exploiting spatiospectral CorrElation, is able to significantly accelerate spectroscopic imaging experiments, making high-resolution metabolic imaging possible.
Keywords: chemical shift imaging; echo-planar spectroscopic imaging; low-rank model; partial separability; spectroscopic imaging; subspace modeling.
Copyright © 2014 Wiley Periodicals, Inc.
Figures

 for subspace estimation.
covers only a limited region of central k-space (based on SNR consideration), and sample the free precession period (TA;1) fully (to capture the spectral information); (b) (k, t)-space sampling for data in
for subspace estimation.
covers only a limited region of central k-space (based on SNR consideration), and sample the free precession period (TA;1) fully (to capture the spectral information); (b) (k, t)-space sampling for data in
 for determination of the spatial coefficients. Note that a set of FIDs with different echo shifts (Δt1, Δt2, … Δtq) is collected, each of which traverses entire k-space (also see Fig. 2) but with limited spectral encoding (TA;2
< TA;1).
for determination of the spatial coefficients. Note that a set of FIDs with different echo shifts (Δt1, Δt2, … Δtq) is collected, each of which traverses entire k-space (also see Fig. 2) but with limited spectral encoding (TA;2
< TA;1).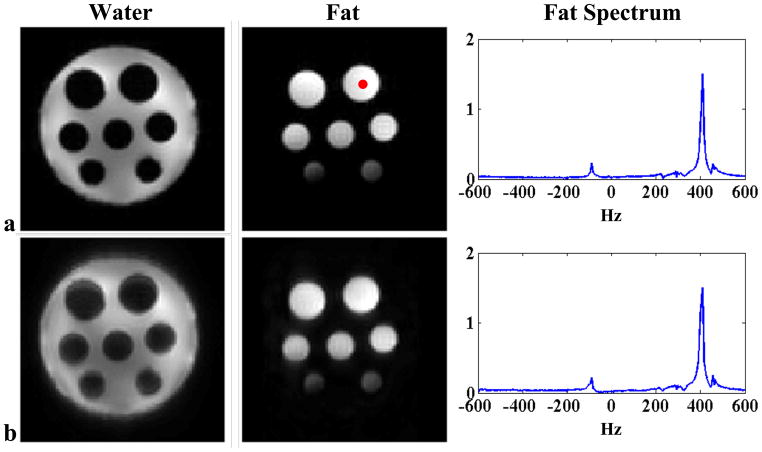 with limited k-space coverage but full spectral encoding, and (b) an EPSI-like component used to acquire the data in
with extended k-space coverage but limited spectral encoding. Note that there is only one ky reversal in each TR due to SNR consideration, although more ky reversals can be included in principle. Note also that the proposed EPSI component supports bipolar acquisition but requires additional correction if data acquired on both positive and negative Gx are used.
with limited k-space coverage but full spectral encoding, and (b) an EPSI-like component used to acquire the data in
with extended k-space coverage but limited spectral encoding. Note that there is only one ky reversal in each TR due to SNR consideration, although more ky reversals can be included in principle. Note also that the proposed EPSI component supports bipolar acquisition but requires additional correction if data acquired on both positive and negative Gx are used.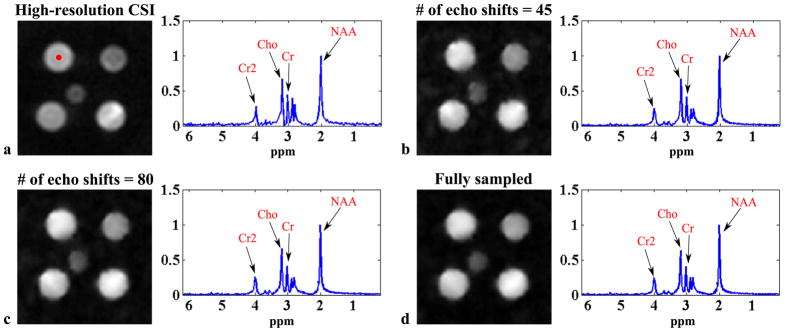 , 48 echo-shifts in
averaged four times and L = 8. The left column shows the spatial distributions of a frequency component at 345 Hz and the right column shows the spectra corresponding to the voxel identified by the red dot for each case.
, 48 echo-shifts in
averaged four times and L = 8. The left column shows the spatial distributions of a frequency component at 345 Hz and the right column shows the spectra corresponding to the voxel identified by the red dot for each case.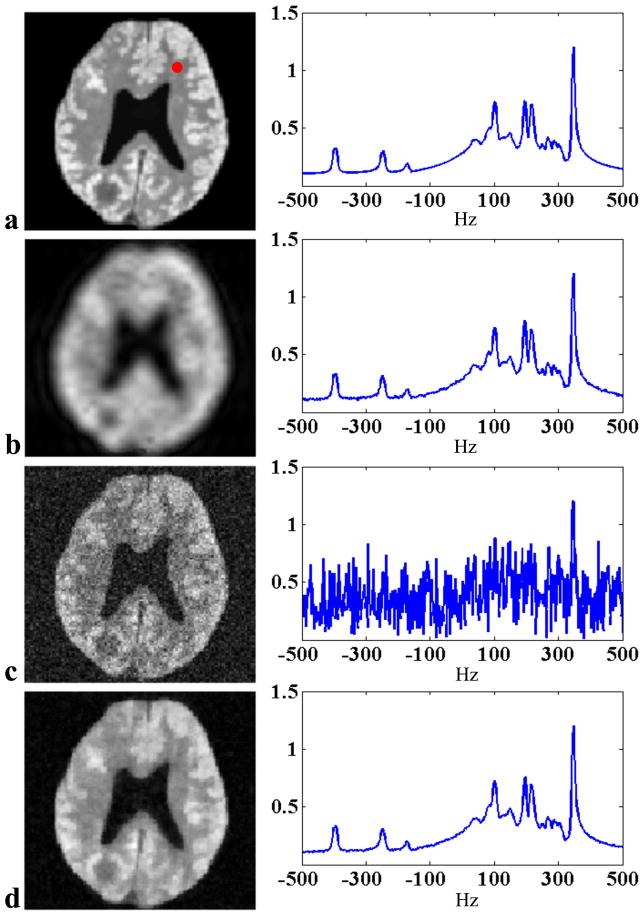 (two temporal interleaves), 48 echo shifts in
(a total of 64 excitations) and L = 16. Note that the reconstructions are almost comparable but the data acquisition time for the SPICE experiment is only 1/4 of that for the EPSI experiment.
(two temporal interleaves), 48 echo shifts in
(a total of 64 excitations) and L = 16. Note that the reconstructions are almost comparable but the data acquisition time for the SPICE experiment is only 1/4 of that for the EPSI experiment.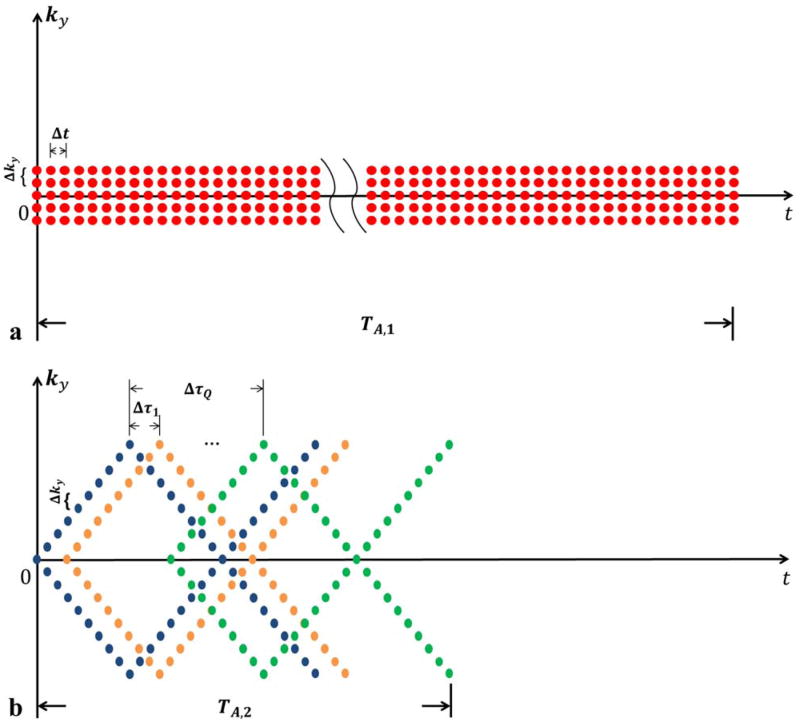 , 45 echo shifts in
with five averages, and L = 12. The left column shows the spatial distributions of NAA and the right column shows the spectra from the voxel identified by the red dot in (a). Field inhomogeneity correction was included for all the cases as described in the text. The results in (d)–(f) correspond to a factor of 10 reduction in data acquisition time (6 min) compared to the high-resolution CSI acquisition in (c).
, 45 echo shifts in
with five averages, and L = 12. The left column shows the spatial distributions of NAA and the right column shows the spectra from the voxel identified by the red dot in (a). Field inhomogeneity correction was included for all the cases as described in the text. The results in (d)–(f) correspond to a factor of 10 reduction in data acquisition time (6 min) compared to the high-resolution CSI acquisition in (c).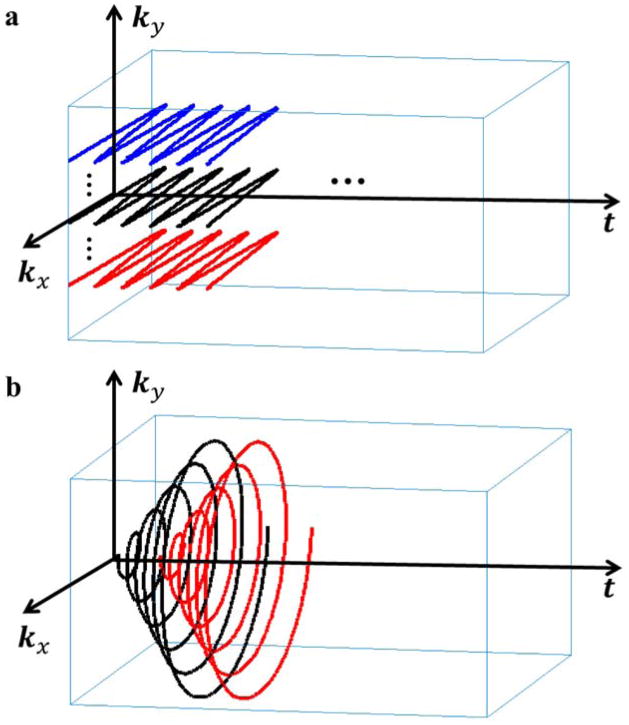 , L = 12 and different numbers of echo shifts in
: (b) 45 echo shifts, (c) 80 echo shifts, and (d) the entire EPSI data set.
, L = 12 and different numbers of echo shifts in
: (b) 45 echo shifts, (c) 80 echo shifts, and (d) the entire EPSI data set.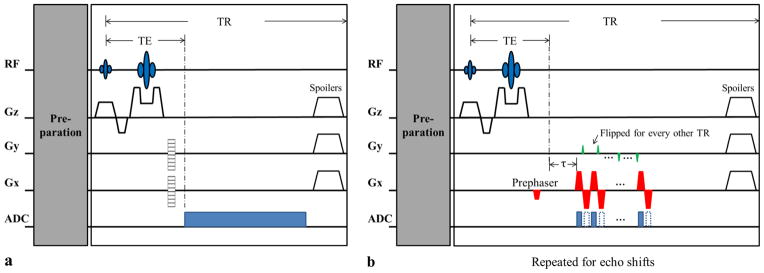 : (a) EPSI trajectories, and (b) spiral EPSI trajectories. Note that in (a), the echo spacing is not constrained by the spectral Nyquist criterion as in traditional EPSI schemes. In both cases, different colors represent trajectories for different excitations.
References
-
- Lauterbur PC, Kramer DM, House WV, Chen CN. Zeugmatographic high resolution nuclear magnetic resonance spectroscopy: Images of chemical inhomogeneity within macroscopic objects. J Amer Chem Soc. 1975;97:6866–6868.
-
- Maudsley AA, Hilal SK, Perman WH, Simon HE. Spatially resolved high resolution spectroscopy by “four-dimensional” NMR. J Magn Reson. 1983;51:147–152.
-
- Pohmann R, von Kienlin M, Haase A. Theoretical evaluation and comparison of fast chemical shift imaging methods. J Magn Reson. 1997;129:145–160. - PubMed
Publication types
MeSH terms
Grants and funding
LinkOut - more resources
Full Text Sources
