. 2014 Jul;32(7):1865-77.
doi: 10.1002/stem.1654.

Cell senescence abrogates the therapeutic potential of human mesenchymal stem cells in the lethal endotoxemia model

Affiliations

Cell senescence abrogates the therapeutic potential of human mesenchymal stem cells in the lethal endotoxemia model

Juan Carlos Sepúlveda et al. Stem Cells. 2014 Jul.

Abstract

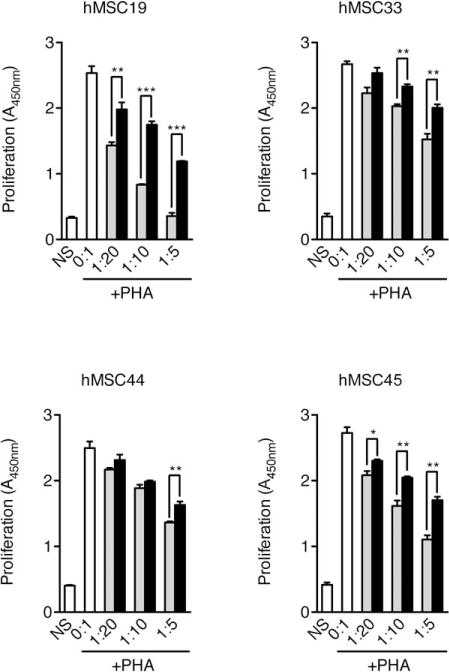
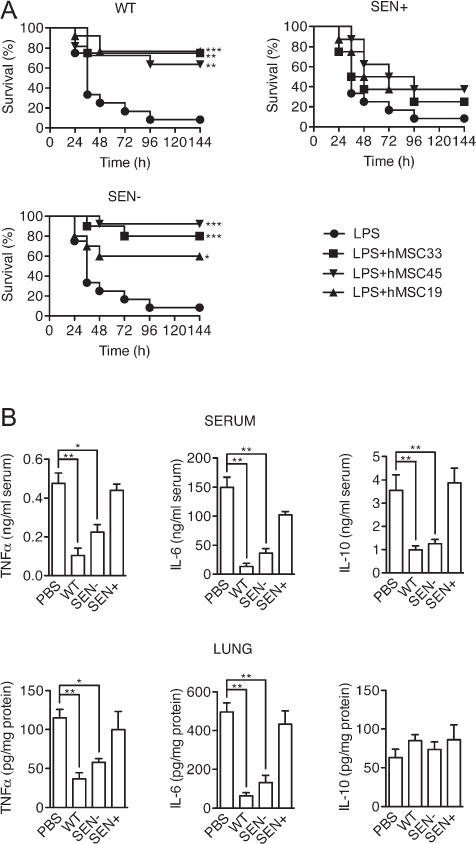
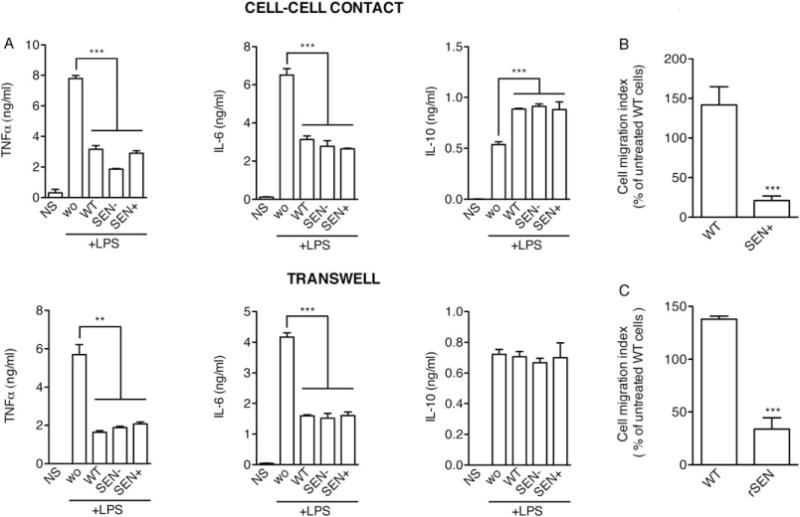
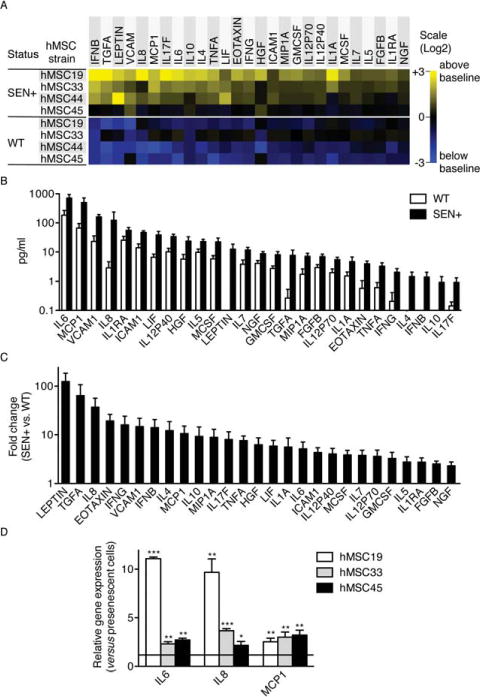
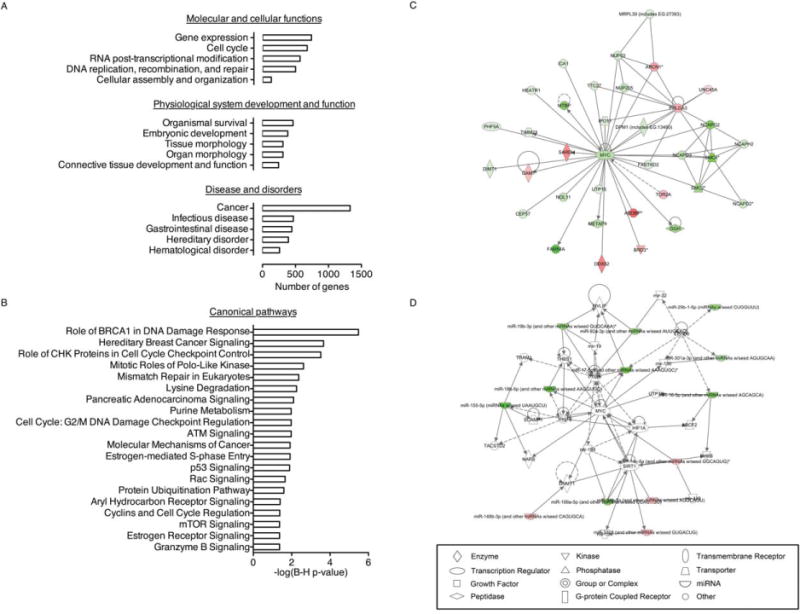
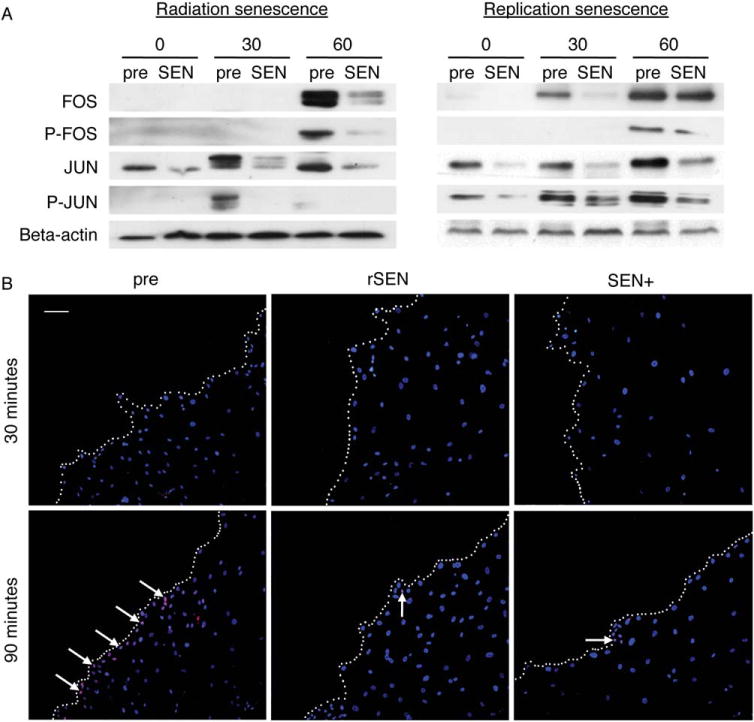
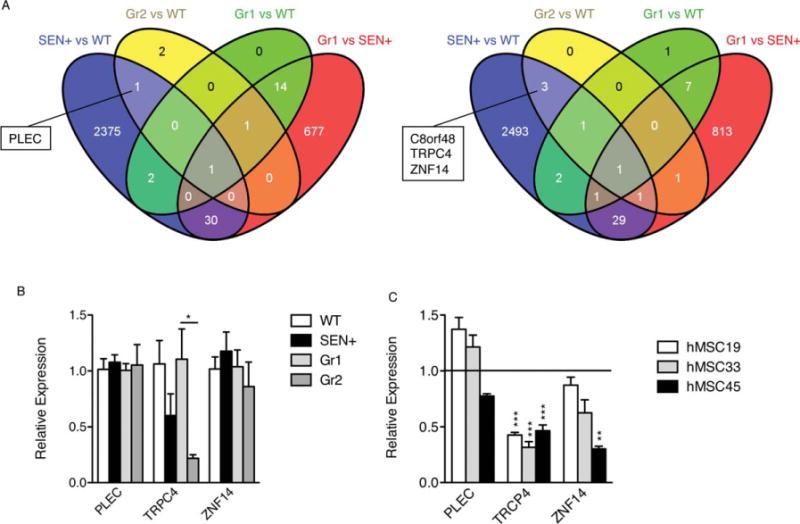
Mesenchymal stem cells (MSCs) possess unique paracrine and immunosuppressive properties, which make them useful candidates for cellular therapy. Here, we address how cellular senescence influences the therapeutic potential of human MSCs (hMSCs). Senescence was induced in bone marrow-derived hMSC cultures with gamma irradiation. Control and senescent cells were tested for their immunoregulatory activity in vitro and in vivo, and an extensive molecular characterization of the phenotypic changes induced by senescence was performed. We also compared the gene expression profiles of senescent hMSCs with a collection of hMSCs used in an ongoing clinical study of Graft Versus Host disease (GVHD). Our results show that senescence induces extensive phenotypic changes in hMSCs and abrogates their protective activity in a murine model of LPS-induced lethal endotoxemia. Although senescent hMSCs retain an ability to regulate the inflammatory response on macrophages in vitro, and, in part retain their capacity to significantly inhibit lymphocyte proliferation, they have a severely impaired migratory capacity in response to proinflammatory signals, which is associated with an inhibition of the AP-1 pathway. Additionally, expression analysis identified PLEC, C8orf48, TRPC4, and ZNF14, as differentially regulated genes in senescent hMSCs that were similarly regulated in those hMSCs which failed to produce a therapeutic effect in a GVHD trial. All the observed phenotypic alterations were confirmed in replicative-senescent hMSCs. In conclusion, this study highlights important changes in the immunomodulatory phenotype of senescent hMSCs and provides candidate gene signatures which may be useful to evaluate the therapeutic potential of hMSCs used in future clinical studies.

Keywords: Cellular therapy; Immunotherapy; Mesenchymal stem cells; Senescence.


Conflict of interest statement

Disclosure of Potential Conflicts of Interest

The authors indicate no potential conflicts of interest.

Figures

Figure 1
Figure 1
Senescent hMSCs have a reduced capacity to inhibit lymphocyte proliferation. Human PBMCs (105) were cultured in triplicate with complete RPMI medium in the presence of PHA (10 μg/ml), and with or without various numbers of bone marrow-derived hMSCs (0:1 to 1:5 MSC/PBMC ratios) from different donors (hMSC19, 33, 44, and 45) in flat-bottomed 96-well plates. After 72 hours of culture, proliferation was evaluated by colorimetric measurement of BrdU incorporation. White bars, PBMC without hMSC; gray bars, PBMC cocultured with wild-type hMSC; black bars, PBMC cocultured with senescent hMSC; NS, non-stimulated PBMC. All data correspond to experiments performed using PBMCs from the same donor. *, p < .05; **, p < .01; ***, p < .005, versus cocultures with nonsenescent hMSCs. Error bars represent SEM. Abbreviations: hMSC, human mesenchymal stem cell; PHA, phytohemagglutinin.
Figure 2
Figure 2
Senescent hMSCs fail to protect against lethal sepsis. Mice (10 mice/group) were injected i.p. with LPS (400 μg/mouse) and treated i.p. with PBS or 106 hMSCs 30 minutes later. Three different hMSC isolates (hMSC19, 33, and 44) were used. WT, wild-type primary hMSCs; SEN+, gamma-irradiated hMSCs; SEN−, telomerase-immortalized hMSCs. (A): Survival was monitored every 12 hours. (B): Cytokine levels were determined by ELISA in protein extracts from blood serum and lung collected 6 hours after LPS injection (n = 5). *, p < .05; **, p < .01; ***, p < .005, versus controls with LPS alone. Error bars represent SEM. Abbreviations: hMSC, human mesenchymal stem cell; LPS, lipopolysaccharide PBS, phosphate buffered saline.
Figure 3
Figure 3
Senescent human mesenchymal stem cells (hMSCs) maintain their intrinsic immunomodulatory activity on stimulated macrophages, but fail to migrate in response of proinflammatory signals. (A): Macrophages (1 × 10⁶ cells/well) were cultured in the presence of LPS (1 μg/ml), alone (wo), or with hMSCs (2 × 10⁵ cells/well). Macrophages cultured in the absence of LPS and hMSCs (NS) were used as negative controls. The experiment was performed with macrophages and hMSCs in the same well (upper panels) or with the macrophages and hMSCs separated by a 0.8 μm-pore transwell (lower panels). Cytokine levels in the medium were determined after 24 hours, by ELISA. WT, wild-type presenescent hMSCs; SEN+, gamma-irradiated hMSCs; SEN−, telomerase-immortalized hMSCs. (B): 1.5 × 10⁴ presenescent (WT) or gamma-irradiated (SEN+) hMSCs were used in transwell migration assays in response to conditioned medium from LPS-stimulated macrophages. (C): 1.5 × 10⁴ presenescent (WT) or replicative-senescent (rSEN) hMSCs were used in trans-well migration assays in response to conditioned medium from LPS-stimulated macrophages. **, p < .01; ***, p < .005, versus controls. Error bars represent SEM (n = 3). Abbreviations: LPS, lipopolysaccharide; WT, wild type.
Figure 4
Figure 4
Senescent hMSCs secrete higher levels of inflammatory mediators compared to WT cells. (A): Soluble factors secreted by the indicated cells were detected by antibody arrays and analyzed as described in the text, Materials and Methods, and Supporting Information. WT, wild-type primary hMSCs; SEN+, gamma-irradiated hMSCs. For each protein, all signals were averaged and used as the baseline. Signals higher than baseline are displayed in yellow; signals below baseline are displayed in blue. The numbers in the heat map key (right) indicate log 2-fold changes from the baseline. Only proteins significantly oversecreted in SEN+ cells (p < .05; compared with WT cells) are represented. (B): Levels of proteins (normalized to 105 cells per milliliter) significantly oversecreted in SEN+ cells compared with WT cells. (C): Fold changes in the levels of proteins significantly oversecreted in SEN+ cells compared with WT cells. When protein levels where under the detection limit, a baseline of 0.1 pg/ml was considered. (D): Relative expression levels of the major SASP components IL6, IL8, and MCP1 were quantified by real-time RT-PCR in three different isolates of presenescent and replicative-senescent hMSCs. α-Tubulin was used as endogenous control. *, p < .05; **, p < .01; ***, p < .005, versus controls. Error bars represent SEM (n = 3). Abbreviations: hMSC, human mesenchymal stem cell; WT, wild type.
Figure 5
Figure 5
Gene function alterations found in SEN+ human mesenchymal stem cells (hMSCs). (A): Genes significantly regulated in SEN+ hMSCs (multiple-test adjusted p-value < .05) in comparison with nonirradiated (WT) cells were analyzed using IPA (Ingenuity Systems, www.ingenuity.com). Graphs show the top five functional categories altered in each of the three IPA major BioFunction groups. The full list of biological functions significantly regulated is shown in Supporting Information Figure S3. (B): Significantly regulated IPA canonical pathways (Benjamini-Hochberg multiple test-corrected p-value < .05). (C): Top network generated using IPA from the list of differentially expressed miRNAs (SEN+ vs. WT hMSCs). Major functions associated with this network are: cancer, reproductive system disease, and connective tissue disorders. Regulated genes appear shaded in green (downregulated) or red (upregulated). (D): Second most significant network found in the list of differentially expressed genes (SEN+ vs. WT hMSCs). Major functions associated with this network are: cellular assembly and organization, cell cycle, and DNA replication, recombination, and repair (Supporting Information Table S5).
Figure 6
Figure 6
Senescent human mesenchymal stem cell (hMSC) shows a strong inhibition of the AP-1 pathway in response to migratory stimuli. (A): Western blot analysis of AP-1 components FOS, JUN, and their phosphorylated forms after treatment of presenescent (pre) or senescent (SEN) hMSCs with conditioned medium from LPS-stimulated macrophages at indicated times (minutes). Representative results from at least three experiments are shown. (B): Analysis of FOS activation at the wound edge. A scratch in a monolayer of presenescent (pre), radiation-induced senescent (SEN+), and replication-induced senescent (rSEN) hMSCs was made as described in Supporting Information. At the indicated times after scratching (30 or 90 minutes), the cells were fixed, permeabilized, and stained with an anti-FOS antibody and the corresponding Cy5-labeled secondary antibody (red). Cell nuclei were counterstained using DAPI (blue). Representative fluorescence microscopy images with merged DAPI and Cy5 signals are shown. White dotted lines indicate the cell migration front (wound edge). White arrows point to some cell nuclei expressing FOS. Scale bar = 100 μm.
Figure 7
Figure 7
Four genes in the microarray analyses appear selectively regulated in both senescent and therapeutically ineffective hMSCs. We searched for genes differentially upregulated or downregulated in both SEN+ and Gr2 samples (therapeutically ineffective) compared with WT samples, but not differentially expressed in Gr1 (therapeutically effective) compared with WT or SEN+ samples. (A): Venn diagrams show the number of RNA probes differentially expressed (adjusted p < .05) in each cell population, analyzed with the Agilent Whole Human Genome Microarray Kit. For SEN+ and WT, n = 4; for Gr1, n = 5; for Gr2, n = 3. (B): Relative expression levels of PLEC, TRPC4, and ZNF14 (endogenous control GAPDH) measured by real-time RT-PCR. The samples used were the same as those used for the microarray analysis. WT (average) was used as a calibrator for SEN samples, and Gr1 (average) was used as a calibrator for Gr2 samples. (C): Relative expression levels of PLEC, TRPC4, and ZNF14 (endogenous control GAPDH) measured by real-time RT-PCR in three different isolates of replicative-senescent hMSCs. *, p < .05; **, p < .01; ***, p < .005, versus presenescent samples. Error bars represent SEM (n = 3). Abbreviations: hMSC, human mesenchymal stem cell; WT, wild type.

References

    1. Bernardo ME, Locatelli F, Fibbe WE. Mesenchymal stromal cells. Ann N Y Acad Sci. 2009;1176:101–117. - PubMed
    1. Gebler A, Zabel O, Seliger B. The immunomodulatory capacity of mesenchymal stem cells. Trends Mol Med. 2012;18:128–134. - PubMed
    1. Polchert D, Sobinsky J, Douglas G, et al. IFN-gamma activation of mesenchymal stem cells for treatment and prevention of graft versus host disease. Eur J Immunol. 2008;38:1745–1755. - PMC - PubMed
    1. Stagg J, Pommey S, Eliopoulos N, et al. Interferon-gamma-stimulated marrow stromal cells: A new type of nonhematopoietic antigen-presenting cell. Blood. 2006;107:2570–2577. - PubMed
    1. Liang X, Ding Y, Zhang Y, et al. Paracrine mechanisms of mesenchymal stem cell-based therapy: Current status and perspectives. Cell Transplant. 2013 doi: 10.3727/096368913X667709. [Epub ahead of print] - DOI - PubMed

Publication types

MeSH terms