. 2014 Jun;32(6):1538-52.
doi: 10.1002/stem.1658.

Low-dose 6-bromoindirubin-3'-oxime induces partial dedifferentiation of endothelial cells to promote increased neovascularization

Affiliations

Low-dose 6-bromoindirubin-3'-oxime induces partial dedifferentiation of endothelial cells to promote increased neovascularization

Erin E Kohler et al. Stem Cells. 2014 Jun.

Abstract

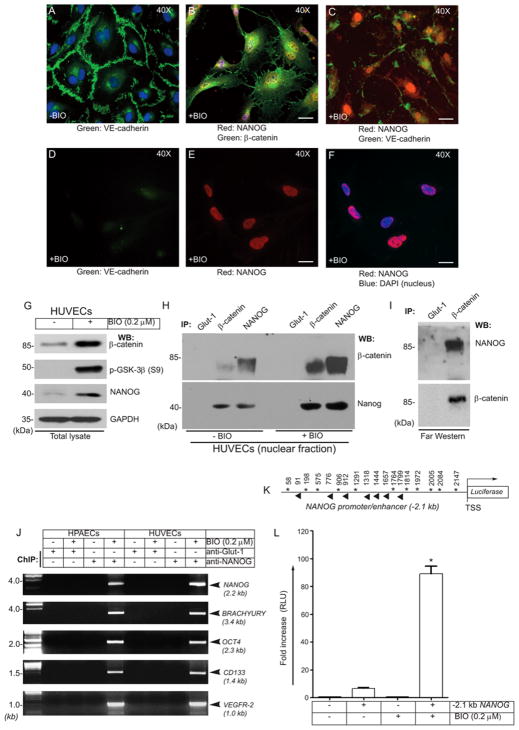
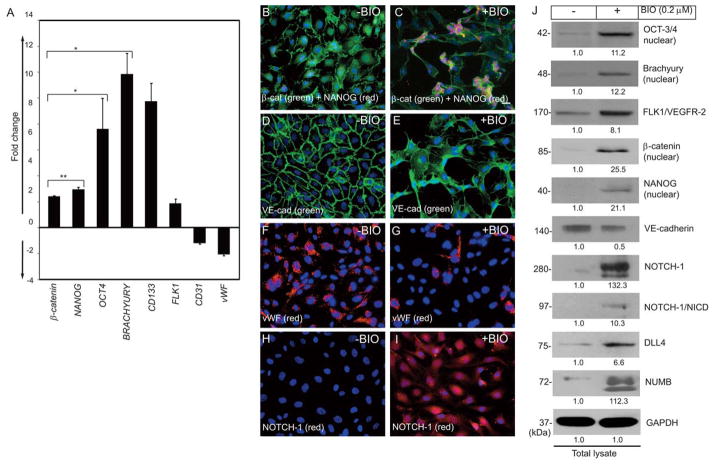
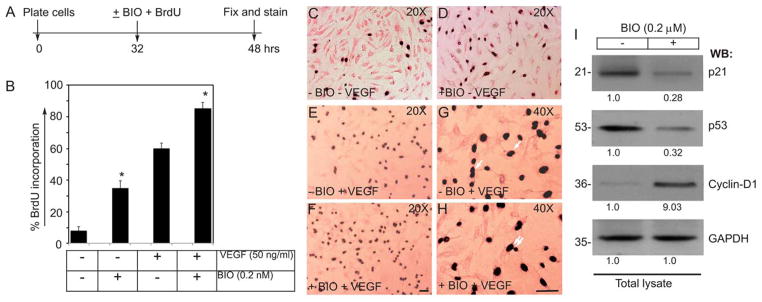
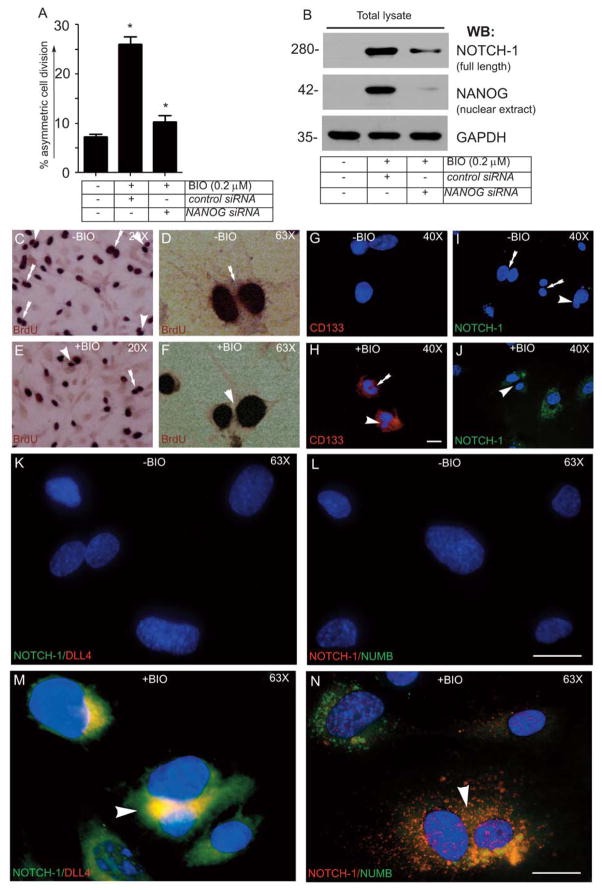
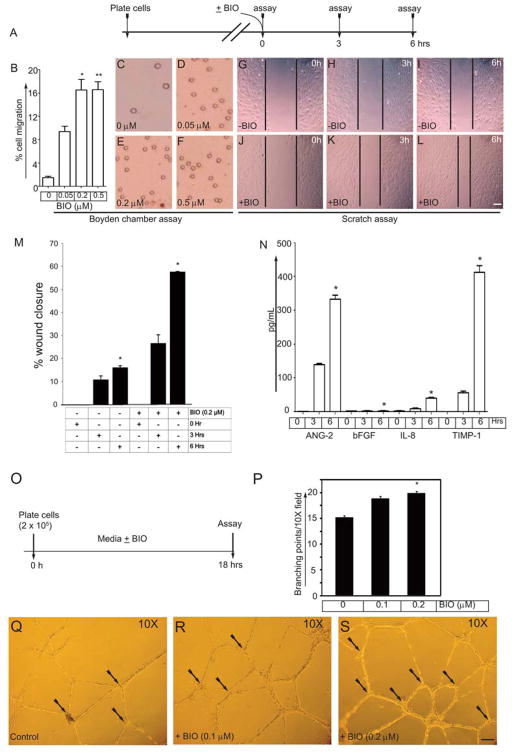
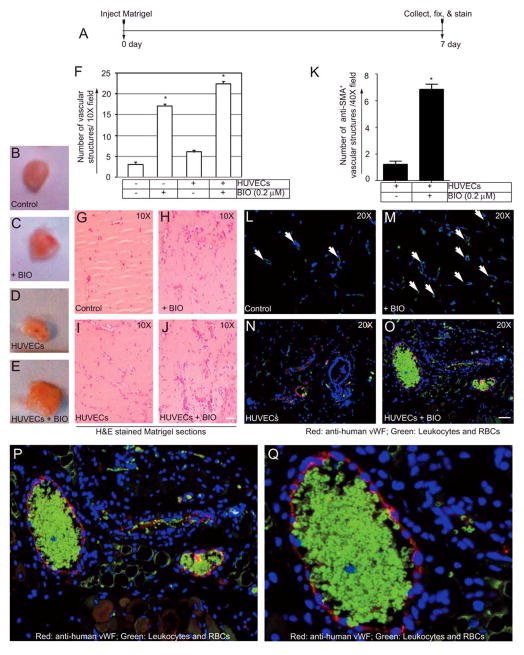
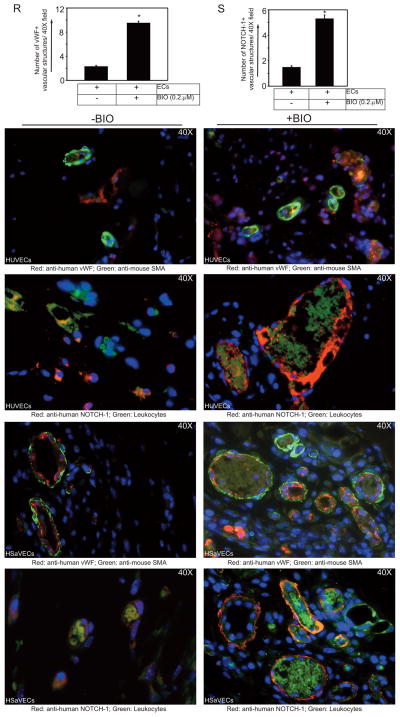
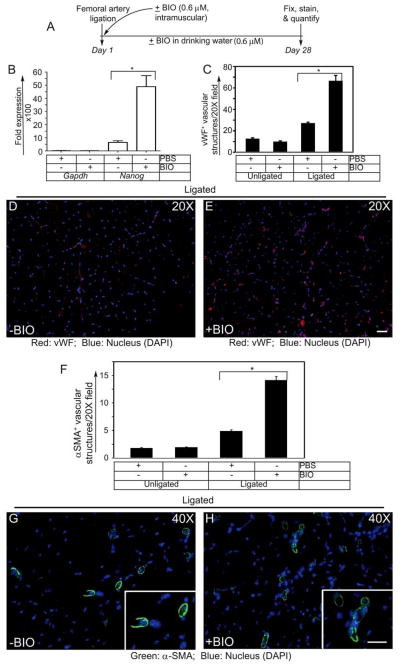
Endothelial cell (EC) dedifferentiation in relation to neovascularization is a poorly understood process. In this report, we addressed the role of Wnt signaling in the mechanisms of neovascularization in adult tissues. Here, we show that a low-dose of 6-bromoindirubin-3'-oxime (BIO), a competitive inhibitor of glycogen synthase kinase-3β, induced the stabilization of β-catenin and its subsequent direct interaction with the transcription factor NANOG in the nucleus of ECs. This event induced loss of VE-cadherin from the adherens junctions, increased EC proliferation accompanied by asymmetric cell division (ACD), and formed cellular aggregates in hanging drop assays indicating the acquisition of a dedifferentiated state. In a chromatin immunoprecipitation assay, nuclear NANOG protein bound to the NANOG- and VEGFR2-promoters in ECs, and the addition of BIO activated the NANOG-promoter-luciferase reporter system in a cell-based assay. Consequently, NANOG-knockdown decreased BIO-induced NOTCH-1 expression, thereby decreasing cell proliferation, ACD, and neovascularization. In a Matrigel plug assay, BIO induced increased neovascularization, secondary to the presence of vascular endothelial growth factor (VEGF). Moreover, in a mouse model of hind limb ischemia, BIO augmented neovascularization that was coupled with increased expression of NOTCH-1 in ECs and increased smooth muscle α-actin(+) cell recruitment around the neovessels. Thus, these results demonstrate the ability of a low-dose of BIO to augment neovascularization secondary to VEGF, a process that was accompanied by a partial dedifferentiation of ECs via β-catenin and the NANOG signaling pathway.

Keywords: 6-Bromoindirubin-3′-oxime; Dedifferentiation; Endothelial cells; Hind limb ischemia; Neovascularization.


Conflict of interest statement

Conflict of Interests

The authors declare no competing financial interests.

Figures

Figure 1
Figure 1. BIO mediates interaction of β-catenin with NANOG, and NANOG binds to the NANOG and BRACHYURY promoters
Sparsely plated HUVECs treated without or with BIO were subjected to staining and microscopy. (A) Anti-VE-cadherin (green), (B) Anti-human β-catenin (green) and anti-human NANOG (red); (C) Anti-human VE-cadherin (green) and anti-human NANOG (red) staining. (D) Reduced VE-cadherin (green) staining in ECs treated with BIO. (E) Nuclear accumulation of NANOG (red). (F) NANOG, red; DAPI, blue (merge). Scale bar is 100 μm. (G) EC extracts were analyzed by immunoblotting with the indicated antibodies. Note: increased β-catenin and NANOG in nuclear extracts. GAPDH represents equal loading. (H) Reciprocal co-IP of NANOG with β-catenin. (I) Far-Western showing the interaction is direct: EC extracts were immunoprecipitated with indicated antibodies, membrane incubated (ligand blotting) with human recombinant NANOG protein (2.0 μg/ml), then analyzed by immunoblotting with anti-human NANOG antibody (top). This blot was stripped then reprobed with anti-β-catenin antibody (bottom). Results are representative of 3 independent experiments. (J) Chromatins IP prepared from HPAECs and HUVECs were analyzed for the presence of indicated promoters. Compared with control cells, anti-NANOG showed enrichment of NANOG, OCT4, BRACHYURY, CD133, and VEGFR-2 promoters after BIO stimulation. In contrast, there was no amplification in anti-Glut-1 ChIP (negative control). (K) Schematic of the NANOG-promoter/enhancer region showing putative NANOG (asterisks, direct strand; diamond, reverse strand) binding consensus sites. The position is relative to the TSS. (L) ECs transiently transfected with pGL4.84 (control) or with pGL4.84-(2.1-NANOG) promoter were treated with BIO (0.2 μM) for 6 hrs. NANOG-promoter Renilla luciferase activity after BIO treatment is presented as the fold induction of RLU (relative luciferase unit) versus control. Results represent the mean of 3 independent experiments ± S.E.M. *, P < 0.05.
Figure 2
Figure 2. Acquisition of a dedifferentiated phenotype by a subset of ECs
(A) Q-RT-PCR showing an increased expression of NANOG, β-catenin, OCT4, BRACHYURY, CD133, and FLK1 after BIO treatment, while the level of vWF and CD31 decreased. The baseline value was calculated as 1 fold. Experiments were repeated at least 5 times. Results represent the mean of 3 independent experiments ± S.E.M. *, P < 0.01. (B–I) Control or BIO (0.2 μM for 6 hrs) treated HUVECs were fixed and stained with the indicated antibodies. (B) β-catenin (green) is mostly distributed in the plasma-membrane, while NANOG (red) is undetectable. (C) Increased accumulation of β-catenin and NANOG in the nucleus in response to BIO stimulation, concomitantly inducing formation of cellular aggregrates. (D) Anti-VE-cadherin (green) staining reveals zipper-like adherens junctions, while (E) BIO induces phenotypic alterations. (F) Anti-vWF staining reveals normal EC characteristics, while (G) BIO down-regulates expression of vWF. Scale bar is 100 μm. Original magnification, 20X. (H) Control HUVECs stained with anti-human NOTCH-1. (I) BIO-treated HUVECs stained with anti-NOTCH-1. (J) Cell extracts prepared from control or BIO treated HUVECs were subjected to Western blotting with indicated antibodies. The numerical values presented below each western blot panels indicate signal intensities in arbitrary units, control signal value was considered 1. Experiments were repeated at least 3 times with replicates.
Figure 3
Figure 3. BIO increases proliferation of HUVECs
(A) Timeline of BrdU incorporation assay. (B) BIO (0.2 μM) stimulation promotes cell cycle progression in primary HUVECs. A greater percentage of HUVECs that were stimulated with BIO showed higher incorporation of BrdU. (C–H) Representative images of BrdU incorporation of control and BIO-treated HUVECs, in presence or in absence of VEGF (50ng/ml). Single and double white arrows indicate SCD and ACD, respectively. Scale bar, 200 μm (I) Representative images of the Western blot analyses of the total cellular proteins prepared from control or BIO treated HUVECs. The numerical values presented below each western blot panels indicate signal intensities in arbitrary units, control signal value was considered 1. Experiments were repeated > 3 times. Results represent the mean of 3 independent experiments ± S.E.M. *, P < 0.01 vs. control.
Figure 4
Figure 4. BIO mediated NANOG expression plays a role in ACD in ECs
(A) Quantification of the percent of ACD of the total dividing cell population using the BrdU assay. Results represent the mean of 3 independent experiments ± S.E.M. *, P < 0.05 vs. control. (B) Western blot analyses for the total proteins prepared from control or BIO treated HUVECs with the indicated antibodies. (C–F) Representative images of BrdU incorporation in vehicle control and BIO-treated HUVECs. (G–I) Representative images of the immunofluorescent staining of control HUVECs with anti-CD133 (red) and anti-NOTCH-1 (green). (H–J) Representative images of BIO treated HUVECs stained with anti-CD133 (red) and anti-NOTCH-1 (green). Representative images of control or BIO treated HUVECs stained with: (K) NOTCH-1 (green) and DLL4 (red); (L) NOTCH-1 (red) and NUMB (green); (M) NOTCH-1 (green) and DLL4 (red); (N) and NOTCH-1 (red) and NUMB (green); DAPI, nucleus (blue). The arrows and arrowheads indicate morphologically distinguishable SCD and ACD, respectively. Experiments were repeated 3 (n=3) times. Scale bar, 150 μm.
Figure 5
Figure 5. BIO induces migration of HUVECs and the secretion of angiogenic factors and augments branching point structures in Matrigel
(A) Timeline of cell migration assay. (B) Quantification of the cell migration through chemotactic Boyden chamber. (C–F) Representative images from the Boyden chamber filters with increasing amounts of BIO. (G–I) Representative images of the control HUVECs with wound introduction at the indicated time points. (J–L) Representative images of the BIO treated HUVECs with wound closure at the indicated time points. Scale bar, 300 μm. (M) Quantification of %wound closure. (N) HUVECs were growth factor and serum starved for 2.5 hrs, washed with 1XPBS, pH 7.4 then stimulated with DMEM (no serum or growth factor) containing BIO (0.2 μM) for indicated period of time. Cell culture supernatants were then subjected to ELISA assay for the indicated angiogenic factors. Experiments were repeated 3 times (n=3) with triplicates. (O) Timeline of Matrigel experiment. (P) HUVECs (2 × 10⁵) were plated onto 12 well dishes coated with growth factor reduced Matrigel supplemented with bFGF (20 ng/ml), VEGF (50 ng/ml), and BIO (0.1 and 0.2 μM). ECs interconnect to form a vascular plexus (branching) like structures, were counted after 18 hrs. Results represent the mean of 3 independent experiments ± S.E.M. *, P < 0.05 vs. control. (Q–S) Representative images of branching points. Black arrows indicate branching points. Experiments were repeated at least 3 times with triplicates.
Figure 6
Figure 6. BIO augments neovascularization of Matrigel implants
(A) Timeline of the Matrigel plug assay. (B–E) Representative images of the Matrigel implants removed from nude mice at day 7, (B and C) are out of focus. (F) Quantification of the vascular structures per 10X field in the H&E stained sections. (G–J) Representative images of the H&E stained section of the Matrigel plugs. Scale bar, 150 μm. (K) Quantification of SMA+ vascular structures per 40X field. Representative images of Matrigel plug sections control or BIO treated HUVECs stained with, (L–O) Anti-mouse CD31 (green) and anti-human vWF (red). Scale bar, 200 μm; (P&Q) Magnified images of O showing vWF positivity of the vascular structure; (R&S) Quantification of the vWF+ and NOTCH-1+ vascular structures per 40X field in the Matrigel loaded with control ECs (-BIO) or ECs pre-treated with BIO (0.2 μM). Panels below are representative images of Matrigel sections with indicated ECs, receiving no BIO (-BIO) or with BIO (0.2 μM) were stained with indicated antibodies. Autofluorescent erythrocytes and leukocytes (green).
Figure 7
Figure 7. BIO augments neovessel formation in a mouse model of HLI
(A) Timeline of the HLI model and regimen of BIO treatment. (B) Q-RT-PCR analysis of Nanog and Gapdh expression in mice receiving PBS (control group) and BIO. (C) Quantification of vWF+ vascular structures in ischemic tibialis anterior (TA) muscles per 20X field. (D&E) Representative images of PBS and BIO-treated ischemic TA muscles stained with anti-vWF (red) and DAPI (blue). (F) Quantification of α-SMA+ vascular structures in ischemic TA muscles per 20X field. (G&H) Representative images of PBS and BIO-treated ischemic TA muscles stained with α-SMA (green) and DAPI (blue). Results represent the mean of 3 independent experiments ± S.E.M. *, P < 0.05. Scale bar, 300 μm.

Similar articles

Cited by

References

    1. Kajstura J, Gurusamy N, Ogórek B, et al. Myocyte turnover in the aging human heart. CIRC RES. 2010;107:1374–1386. - PubMed
    1. Frati C, Savi M, Graiani G, et al. Resident cardiac stem cells. CURR PHARM DES. 2011;17:3252–3257. - PubMed
    1. Leri A, Kajstura J, Anversa P. Mechanisms of myocardial regeneration. TRENDS CARDIOVASC MED. 2011;21:52–58. - PMC - PubMed
    1. Jopling C, Sleep E, Raya M, et al. Zebrafish heart regeneration occurs by cardiomyocyte dedifferentiation and proliferation. NATURE. 2010;464:606–609. - PMC - PubMed
    1. Jopling C, Boue S, Izpisua Belmonte JC. Dedifferentiation, transdifferentiation and reprogramming: three routes to regeneration. NAT REV MOL CELL BIOL. 2011;12:79–89. - PubMed

Publication types

MeSH terms