. 2014 Apr;42(7):4208-19.
doi: 10.1093/nar/gku102. Epub 2014 Feb 4.

Constructing module maps for integrated analysis of heterogeneous biological networks

Affiliations

Constructing module maps for integrated analysis of heterogeneous biological networks

David Amar et al. Nucleic Acids Res. 2014 Apr.

Abstract

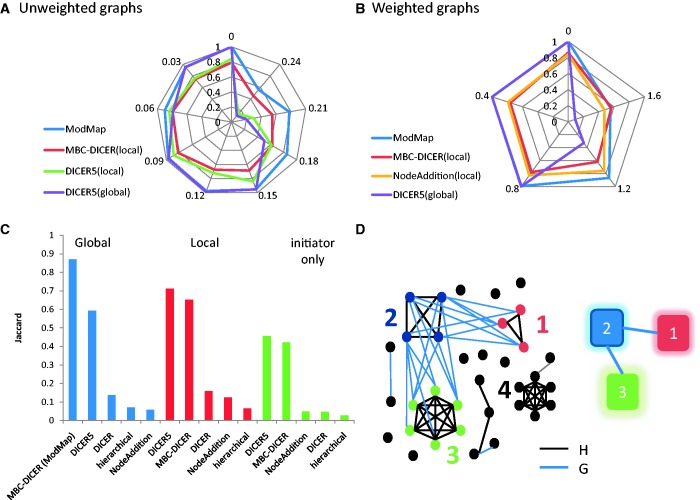
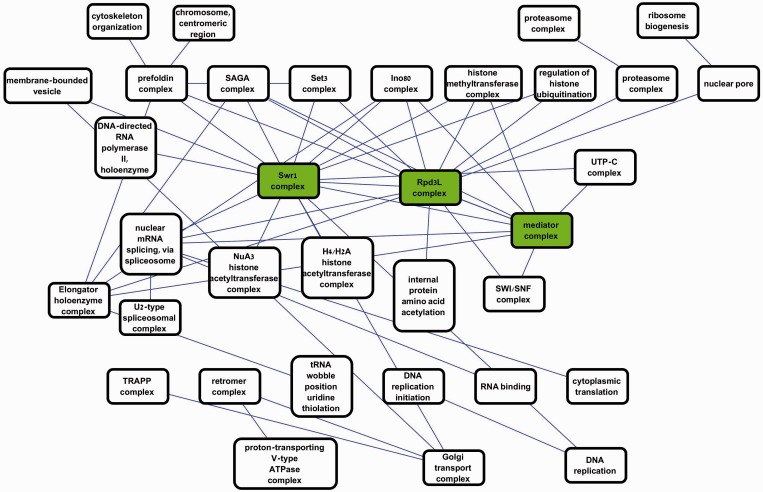
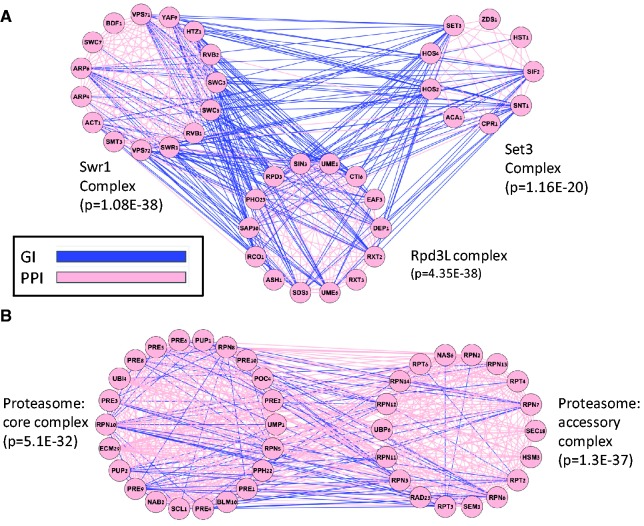
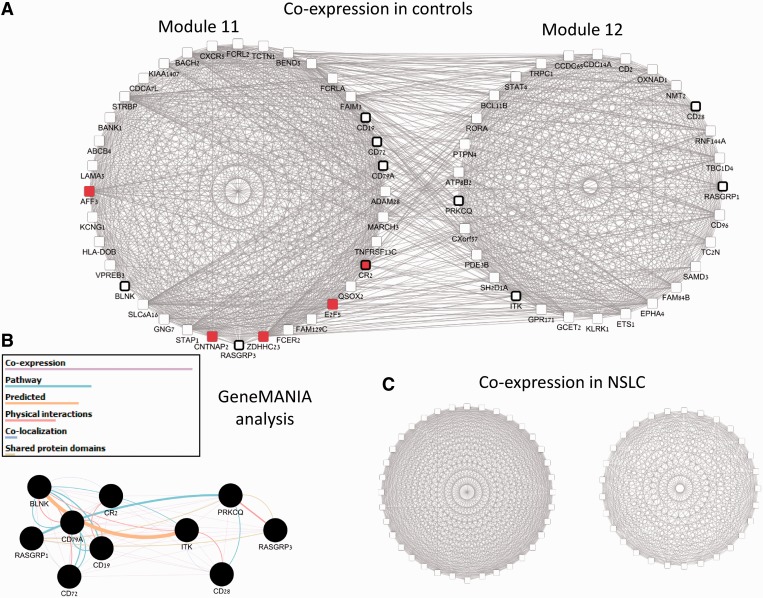
Improved methods for integrated analysis of heterogeneous large-scale omic data are direly needed. Here, we take a network-based approach to this challenge. Given two networks, representing different types of gene interactions, we construct a map of linked modules, where modules are genes strongly connected in the first network and links represent strong inter-module connections in the second. We develop novel algorithms that considerably outperform prior art on simulated and real data from three distinct domains. First, by analyzing protein-protein interactions and negative genetic interactions in yeast, we discover epistatic relations among protein complexes. Second, we analyze protein-protein interactions and DNA damage-specific positive genetic interactions in yeast and reveal functional rewiring among protein complexes, suggesting novel mechanisms of DNA damage response. Finally, using transcriptomes of non-small-cell lung cancer patients, we analyze networks of global co-expression and disease-dependent differential co-expression and identify a sharp drop in correlation between two modules of immune activation processes, with possible microRNA control. Our study demonstrates that module maps are a powerful tool for deeper analysis of heterogeneous high-throughput omic data.


Figures

Figure 1.
Figure 1.
Module map: example and simulation results. (A and B) Performance of module map algorithms on 500-node graphs. (A) Unweighted graphs. (B) Weighted graphs. Each simulated pair of graphs contained an embedded module map of six modules in a tree structure. In addition, two random cliques and two bicliques were embedded in the graphs as decoys. Module, clique and biclique size was chosen uniformly at random between 10 and 20. In the unweighted model (A) each edge was replaced by a non-edge with probability P and vice versa. In the weighted model (B) edge weights are sampled from the normal distribution N(1,σ), and non-edge weights are sampled from the normal distribution N(−1, σ). Results are averages of 10 simulations for each data point. The four top performing algorithms for each simulation are presented using radar plots. MBC-DICER with global improvement is denoted as ModMap. The Jaccard coefficient between the modules produced by each algorithm and the true modules is shown as the distance from the center. Consecutive spokes from the top anticlockwise show increasing values of P in A and of σ in B. (C) Comparison of module map algorithms on unweighted graphs with 1000 nodes, containing a map of 10 modules and five decoys and P = 0.15. (D) A toy example of the module map problem; left: the two networks. Nodes are genes, H edges are black and G edges are blue; right: the module map. Nodes are modules and edges are links. Colors and numbers are the same on the left and right. The map contains three modules: module 2 is linked to modules 1 and 3, whereas module 1 and 3 are not linked. Black nodes are not part of the module map. The graph H (black edges) contains a clique that is not linked in G to another module and thus is not a part of the map. The example also demonstrates the difference between the local and global approaches. The local approach identifies modules 1 and 2 as linked, whereas the global approach also identifies module 3 as linked to module 2. See text.
Figure 2.
Figure 2.
The yeast module map. Each node is a module in the yeast PPI network. The name of a node is the most significantly enriched GO term for that module. Each edge represents a highly significant link between two modules in the negative GI network (P < 1E-50). Modules that were not enriched for any GO term at 0.05 FDR are not shown. Three main chromatin-related hubs are marked in green. Some links connect disjoint modules enriched with similar GO terms (e.g. proteasome–proteasome link, top right), and other links show epistasis between different biological processes (e.g. nuclear pore and ribosome biogenesis, top right).
Figure 3.
Figure 3.
Examples of linked modules in the yeast module map. The genes of each module are arranged in a circle. Blue edges represent negative GIs and pink edges represent PPIs. For each module, the most enriched GO term is shown along with its enrichment P-value. (A) Linkage among different protein complexes. The significance of the links between Rpd3L and the Set3 complexes and between Swr1 and Rpd3L complexes is <10E-70. The link between Swr1 and Set3 is also highly significant (P = 4.29E-59). (B) Detection of subcomplexes. The joint analysis of the PPI and GI networks partitions the proteasome complex into its two subcomplexes: the accessory and the core complex.
Figure 4.
Figure 4.
A module map of DNA damage-specific positive GIs. (A) A module map of the significantly enriched modules. Nodes represent modules and edges represent significant links (Bonferonni corrected P < 0.05). The name of a node is the most significantly enriched GO term. (B) A closer look at the DNA repair module and three-linked modules. Nodes represent genes and edges represent interactions: blue—DNA damage-specific positive GIs, pink—PPIs, black—stable positive GIs, which are observed both in the untreated and in the treated cells. This map shows the emerging connections between functional modules on DNA damage response covering DNA repair and checkpoint responses in the DNA repair module, response to damaged replication forks (the DNA damage response module), DNA double-stranded response genes (RAD52 module) and RNA degradation-related genes (SKI complex module). The RAD52 and SKI modules do not appear in A, as they reflect functions that do not have established GO terms.
Figure 5.
Figure 5.
A pair of immune activation-related modules differentially correlated in NSCLC. (A) Two-linked modules, which are a part of the constructed module map. Nodes are genes and edges represent correlation >0.4 between the genes in the expression patterns of control class. Edges here correspond to high co-expression between two genes and do not reflect the weights in the CC or DC networks. We observe strong co-expression both within and between the modules. Nodes with black frames are related to immune activation response (six T-cell activation genes in module 11 and four B-cell activation genes in module 12). Red nodes in module 11 are targets of mir-34 family. (B) GeneMANIA analysis of the T-cell and B-cell signaling pathway genes shows that the genes of both modules are expected to interact in healthy controls. (C) The same two modules and their co-expression network in the NSCLC class. As in A, the genes within each module are highly co-expressed. In contrast to A, co-expression between the modules is completely diminished.

References

    1. Enright AJ, Van Dongen S, Ouzounis CA. An efficient algorithm for large-scale detection of protein families. Nucleic Acids Res. 2002;30:1575–1584. - PMC - PubMed
    1. Deng MH, Zhang K, Mehta S, Chen T, Sun FZ. Prediction of protein function using protein-protein interaction data. J. Comput. Biol. 2003;10:947–960. - PubMed
    1. Kharchenko P, Chen L, Freund Y, Vitkup D, Church GM. Identifying metabolic enzymes with multiple types of association evidence. BMC Bioinformatics. 2006;7:177. - PMC - PubMed
    1. Pandey G, Myers CL, Kumar V. Incorporating functional inter-relationships into protein function prediction algorithms. BMC Bioinformatics. 2009;10:142. - PMC - PubMed
    1. Sharan R, Ulitsky I, Shamir R. Network-based prediction of protein function. Mol. Syst. Biol. 2007;3:88. - PMC - PubMed

Publication types