. 2014 Apr;42(7):4332-47.
doi: 10.1093/nar/gku096. Epub 2014 Feb 4.

The transcript elongation factor SPT4/SPT5 is involved in auxin-related gene expression in Arabidopsis

Affiliations

The transcript elongation factor SPT4/SPT5 is involved in auxin-related gene expression in Arabidopsis

Julius Dürr et al. Nucleic Acids Res. 2014 Apr.

Abstract

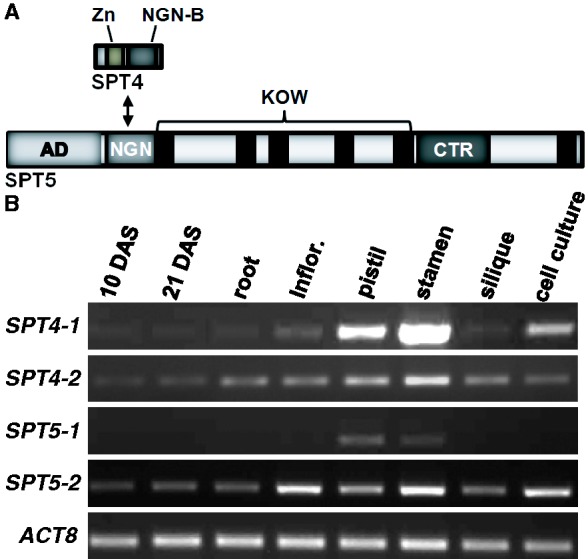
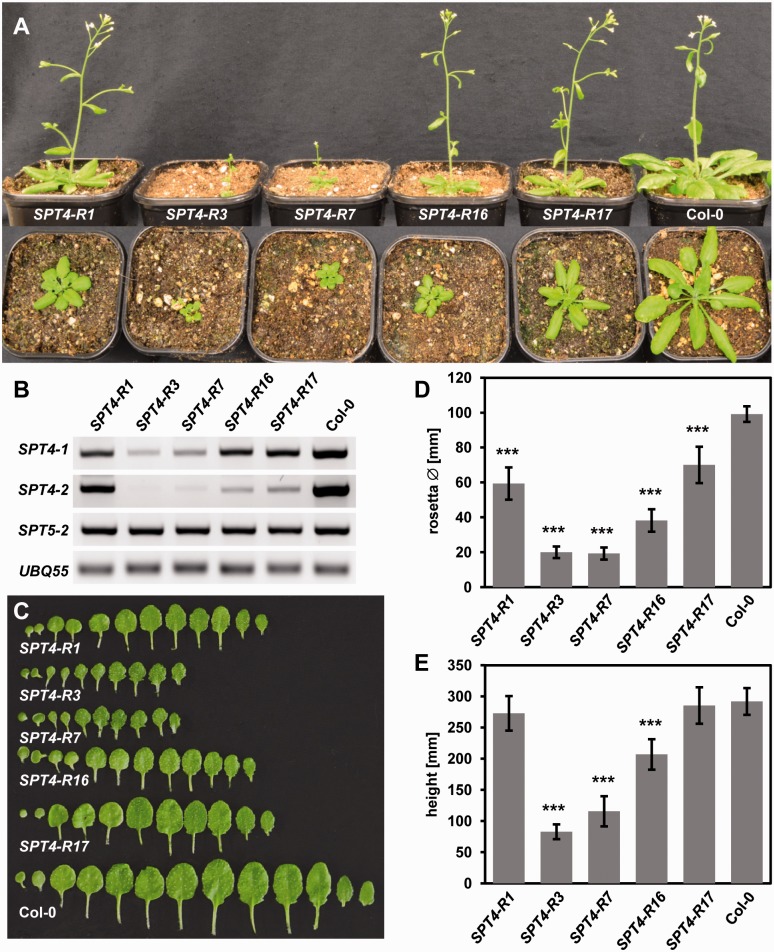
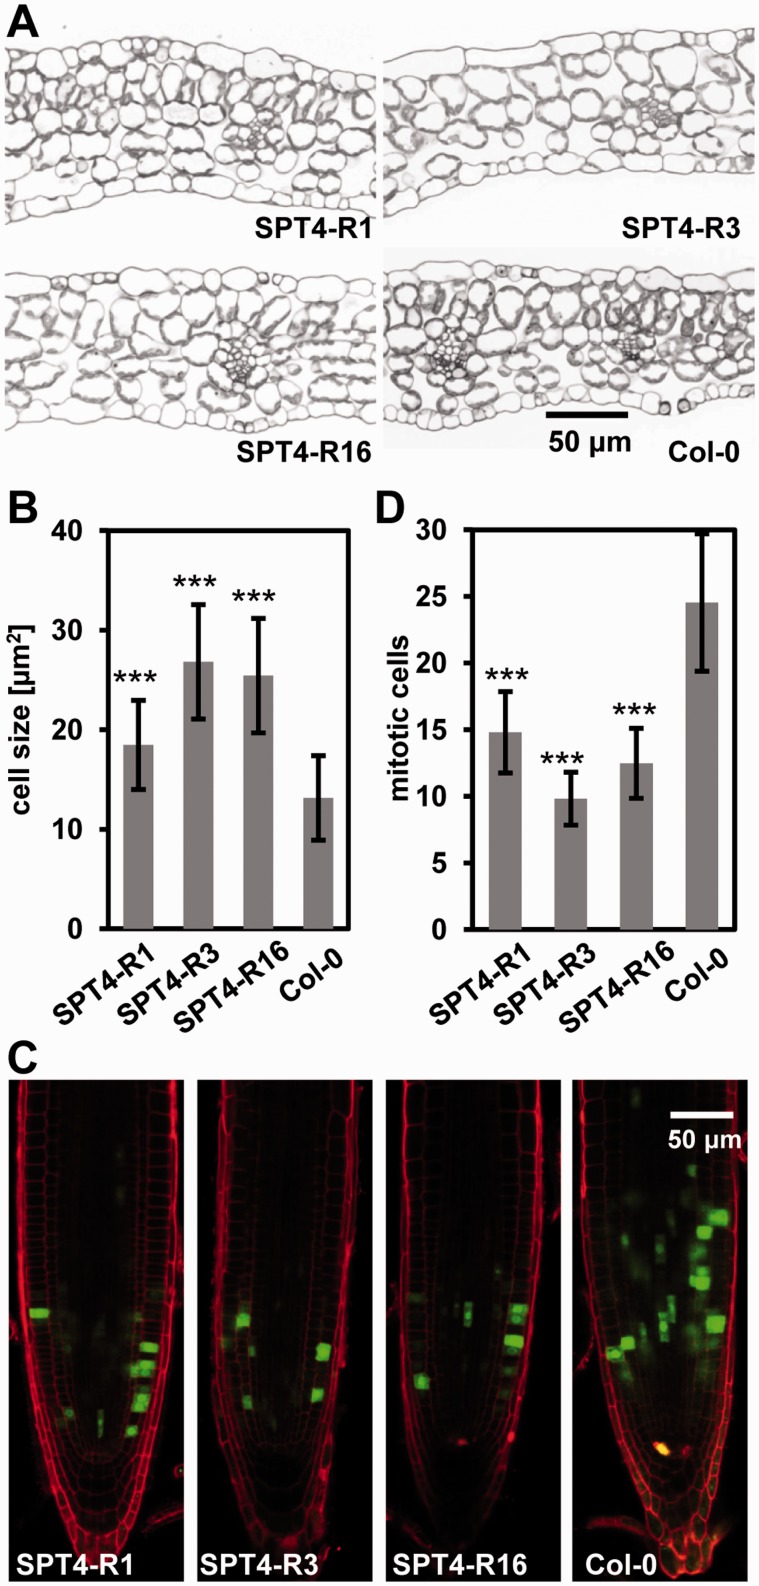
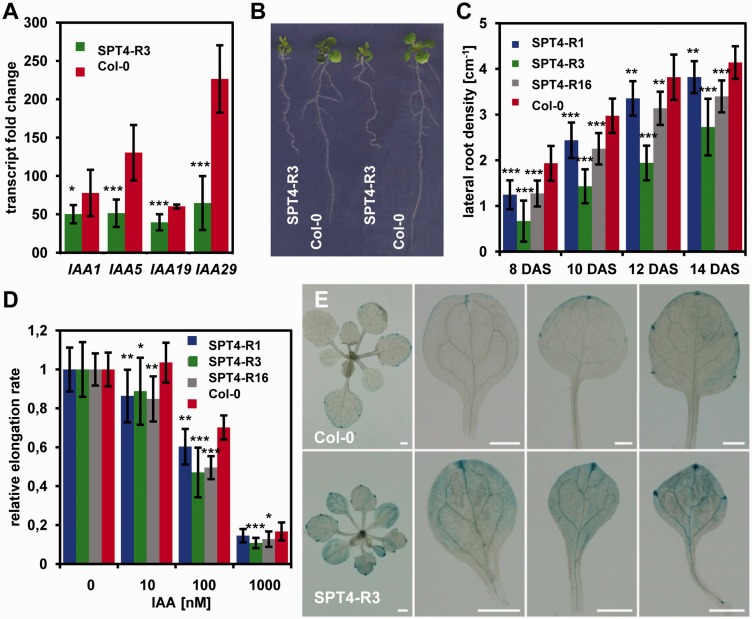
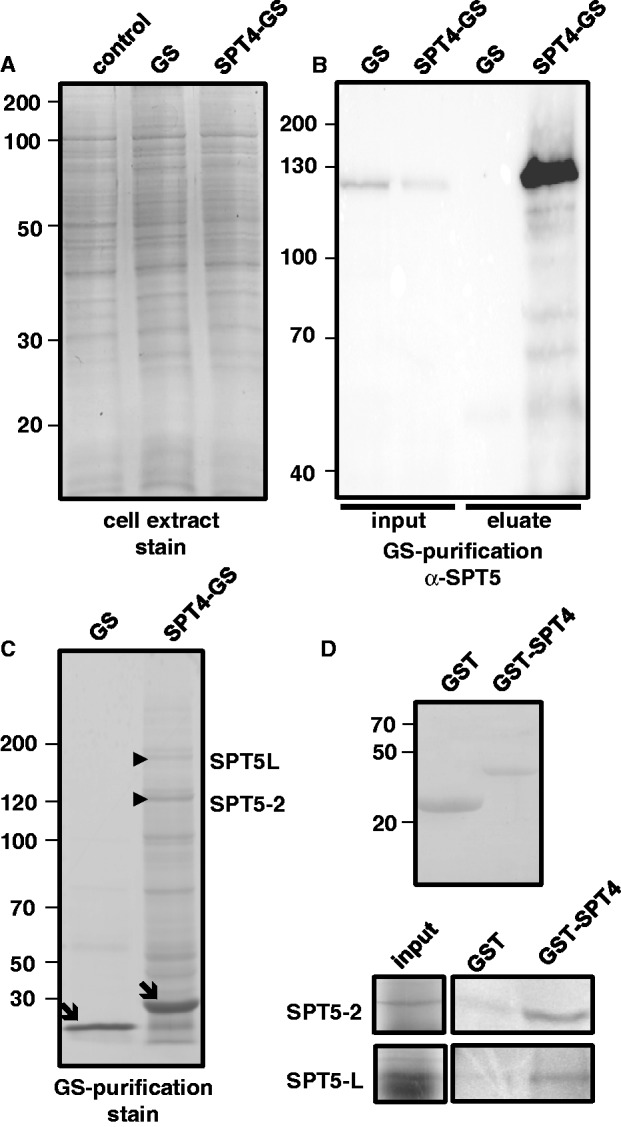
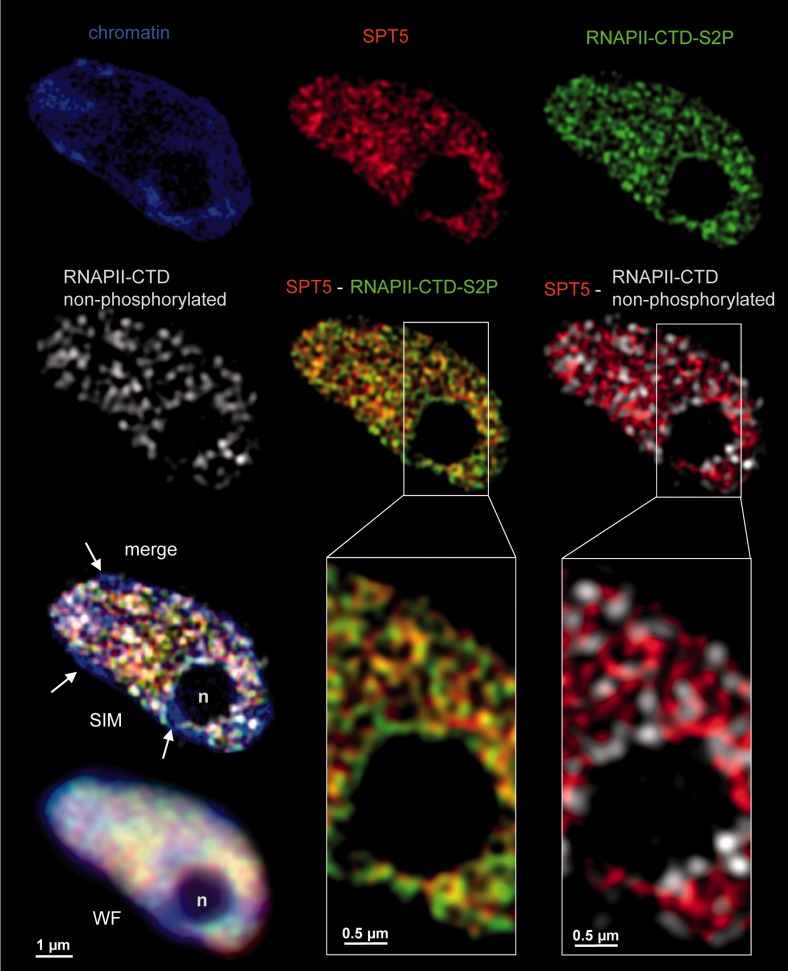
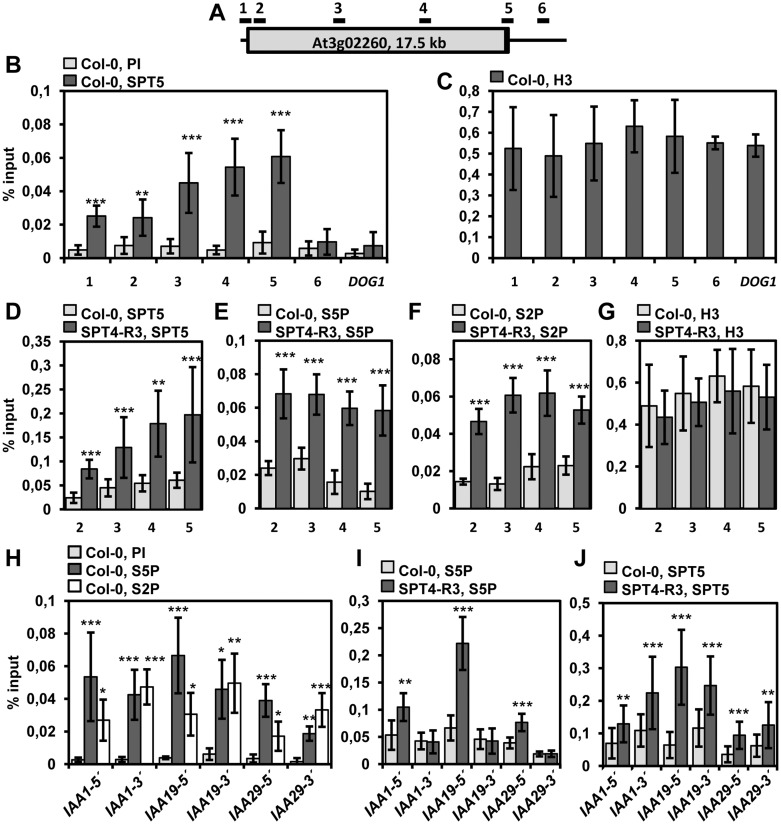
The heterodimeric complex SPT4/SPT5 is a transcript elongation factor (TEF) that directly interacts with RNA polymerase II (RNAPII) to regulate messenger RNA synthesis in the chromatin context. We provide biochemical evidence that in Arabidopsis, SPT4 occurs in a complex with SPT5, demonstrating that the SPT4/SPT5 complex is conserved in plants. Each subunit is encoded by two genes SPT4-1/2 and SPT5-1/2. A mutant affected in the tissue-specifically expressed SPT5-1 is viable, whereas inactivation of the generally expressed SPT5-2 is homozygous lethal. RNAi-mediated downregulation of SPT4 decreases cell proliferation and causes growth reduction and developmental defects. These plants display especially auxin signalling phenotypes. Consistently, auxin-related genes, most strikingly AUX/IAA genes, are downregulated in SPT4-RNAi plants that exhibit an enhanced auxin response. In Arabidopsis nuclei, SPT5 clearly localizes to the transcriptionally active euchromatin, and essentially co-localizes with transcribing RNAPII. Typical for TEFs, SPT5 is found over the entire transcription unit of RNAPII-transcribed genes. In SPT4-RNAi plants, elevated levels of RNAPII and SPT5 are detected within transcribed regions (including those of downregulated genes), indicating transcript elongation defects in these plants. Therefore, SPT4/SPT5 acts as a TEF in Arabidopsis, regulating transcription during the elongation stage with particular impact on the expression of certain auxin-related genes.


Figures

Figure 1.
Figure 1.
Schematic representation of Arabidopsis SPT4–SPT5 and expression of the SPT4/SPT5 genes. (A) Domain structure of SPT4 and SPT5, see text for details. (B) Transcript levels of the SPT4-1/2 and SPT5-1/2 genes as well as of the reference gene ACT8, were examined by rtPCR and a representative experiment is shown. RNA samples derived from selected tissues (aerial parts of 10 and 21 days after stratification (DAS) seedlings, roots, inflorescence heads, pistils, stamen, fully elongated green siliques and suspension cultured cells) were analysed with gene-specific primers.
Figure 2.
Figure 2.
Phenotype of SPT4-RNAi plants. (A) Representative individuals of the different RNAi lines relative to Col-0 (28 DAS top, 21 DAS bottom) are shown. (B) The transcript levels of SPT4-1/2, SPT5-2 and the reference gene UBQ5 in the RNAi lines and Col-0 were examined by rtPCR with gene-specific primers. The RNA was isolated from 10 DAS plants and a typical result is shown. (C) Leaves were photographed of 26 DAS plants grown on solid MS. Rosette diameter 35 DAS (D) and plant height 15 d after bolting (E) were determined and analysed using a one-way analysis of variance (ANOVA). Error bars indicate SD of at least 10 plants. Data sets marked with asterisks are significantly different from Col-0 as assessed by Dunnett’s multiple comparison test: *P < 0.05, **P < 0.01 or ***P < 0.001. Each experiment was performed at least three times with similar results.
Figure 3.
Figure 3.
SPT4-RNAi plants have larger cells, but are affected in cell proliferation. (A) Sections of leaves (12 DAS) of the different RNAi plant lines and Col-0. (B) Quantification of palisade parenchyma cell size based on light microscopic images. Cell size was analysed using a one-way ANOVA. Error bars indicate SD of at least 57 cells. Data sets marked with asterisks are significantly different from Col-0 as assessed by Dunnett’s multiple comparison test: *P < 0.05, **P < 0.01 or ***P < 0.001. (C) CLSM of primary root tips of the different plant lines (5 DAS) harbouring a pCYCB1;1-GFP reporter (GFP fluorescence in green and propidium iodide staining in red). (D) The number of GFP-expressing mitotic cells per root tip was analysed using a one-way ANOVA. Error bars indicate SD of at least 23 roots of three independent experiments. Data sets marked with asterisks are significantly different from Col-0 as assessed by Dunnett’s multiple comparison test: *P < 0.05, **P < 0.01 or ***P < 0.001.
Figure 4.
Figure 4.
SPT4-RNAi plants display auxin-related defects. (A) Reduced IAA inducibility of AUX/IAA genes. Six DAS seedlings were treated for 2 h with 20 µM IAA, and transcript levels of the indicated AUX/IAA genes were measured using quantitative rtPCR. Fold change in transcript levels after IAA treatment was analysed using a one-way ANOVA. Error bars indicate SD of at least three biological and three technical replicates. Data sets marked with asterisks are significantly different from Col-0 as assessed by Dunnett’s multiple comparison test: *P < 0.05, **P < 0.01 or ***P < 0.001. (B) Documentation of 10 DAS plants grown on solid MS. (C) The number of lateral roots per centimetre of primary root was scored at the indicated DAS. Data were analysed using a one-way ANOVA. Error bars indicate SD of at least 14 plants. Data sets marked with asterisks are significantly different from Col-0 as assessed by Dunnett’s multiple comparison test: *P < 0.05, **P < 0.01 or ***P > 0.001. The experiment was performed three times with similar results. (D) Elongation rate of the primary root at different IAA concentrations relative to untreated plants. The relative elongation rate was analysed using a one-way ANOVA. Error bars indicate SD of at least 13 plants. Data sets marked with asterisks are significantly different from wild-type as assessed by Dunnett’s multiple comparison test: *P < 0.05, **P < 0.01 or ***P < 0.001. The experiment was performed twice with similar results. (E) Response to auxin as visualized using the DR5-GUS reporter. Col-0 and SPT4-R3 plants harbouring the DR5-GUS reporter were histochemically stained for GUS activity and representative images are shown. Aerial part of plants (18 DAS), cotyledon, first and second leaf (from left to right) were analysed. Size bars correspond to 1 mm.
Figure 5.
Figure 5.
SPT4 occurs in a complex with SPT5 and SPT5L. (A) Protein extracts of untransformed cells and of cells expressing unfused GS or SPT4-GS after SDS-PAGE and Coomassie-staining of the gel. (B) Immunoblot analysis with an anti-SPT5 serum of input samples and eluates of the GS/SPT4-GS affinity purifications. (C) Eluates of the affinity purifications after SDS-PAGE and Coomassie-staining of the gel. The unfused GS-tag and SPT4-GS are indicated by arrows, whereas the bands corresponding to SPT5-2 and SPT5L, identified by mass spectrometry in the SPT4-GS eluate, are indicated by arrowheads. (D) Pull-down assays with recombinant GST and GST-SPT4 (shown in the top panel).The N-terminal regions of in vitro translated 35S-Met-labelled SPT5-2 (aa1-314) and SPT5L (aa1-294) were incubated with immobilized GST and GST-SPT4-2. After washing the glutathione beads, eluted proteins were analysed by SDS-PAGE and detected by phosphorimaging (bottom panels). Aliquots of the protein input samples (25%) are also shown.
Figure 6.
Figure 6.
SPT5 localizes to transcriptionally active euchromatin. Co-localization analysis of SPT5 (red) with elongating RNAPII (CTD-S2P, green) and RNAPII (non-phosphorylated CTD, white) within euchromatic regions of the nucleus of a meristematic cell visualized by SIM. The nucleus was counterstained with DAPI (blue). The proteins evident as looped fibres form differential reticulate structures sometimes in contact with each other and with chromatin. They are not present in the nucleolus (n) and within heterochromatin (arrows). For comparison with the SIM images, the merged nucleus (four colours) is also shown in wide-field (WF) illumination. Analysis of the degree of co-localization between SPT5 and the RNAPII signals (overlap coefficient, OC) revealed that SPT5 is more clearly associated with the elongating (OC = 0.86; n = 18; SD = 0.0240) than with the non-phosphorylated (OC = 0.71; n = 18; SD = 0.0212) form of RNAPII. The preferential association of SPT5 with RNAPII-CTD-S2P rather than the non-phosphorylated form of RNAPII is also obvious from the insets.
Figure 7.
Figure 7.
SPT5 associates with the transcribed region of genes transcribed by RNAPII. (A) Schematic representation (not drawn to scale) of At3g02260 with the boxed region indicating the transcribed region (exons, introns) of 17.5 kb and the bars above indicate the relative positions of the regions analysed by ChIP in (B–G). ChIP analyses of At3g02260 in (B–G) and of the indicated AUX/IAA genes (5′and 3′ indicate that the PCR amplicon is located in the 5′ or 3′ part of the transcribed region, respectively) in (H–J). The analysed genotype (Col-0 or SPT4-R3) is given above each histogram as well as the used antibody: PI, preimmune; SPT5; H3; S2P (RNAPII-CTD phospho-Ser2); S5P (RNAPII-CTD phospho-Ser5). For the ChIP experiments, percentage input was determined by qPCR and analysed using one-way ANOVA. Error bars indicate SD of at least three biological and three technical replicates. Data sets marked with asterisks are significantly different from PI (B, H) or wild-type (D–G, I, J) as assessed by Dunnett’s multiple comparison test: *P < 0.05, **P < 0.01 or ***P < 0.001.

Similar articles

Cited by

References

    1. Saunders A, Core LJ, Lis JT. Breaking barriers to transcription elongation. Nat. Rev. Mol. Cell Biol. 2006;7:557–567. - PubMed
    1. Selth LA, Sigurdsson S, Svejstrup JQ. Transcript elongation by RNA Polymerase II. Ann. Rev. Biochem. 2010;79:271–293. - PubMed
    1. Sims RJ, Belotserkovskaya R, Reinberg D. Elongation by RNA polymerase II: the short and the long of it. Genes Dev. 2004;18:2437–2468. - PubMed
    1. Grasser KD. Emerging role for transcript elongation in plant development. Trends Plant Sci. 2005;10:484–490. - PubMed
    1. Smith E, Shilatifard A. Transcriptional elongation checkpoint control in development and disease. Genes Dev. 2013;27:1079–1088. - PMC - PubMed

Publication types

MeSH terms

Substances