

MALDI imaging mass spectrometry profiling of proteins and lipids in clear cell renal cell carcinoma
- PMID: 24497498
- PMCID: PMC4331029
- DOI: 10.1002/pmic.201300434
MALDI imaging mass spectrometry profiling of proteins and lipids in clear cell renal cell carcinoma
Abstract
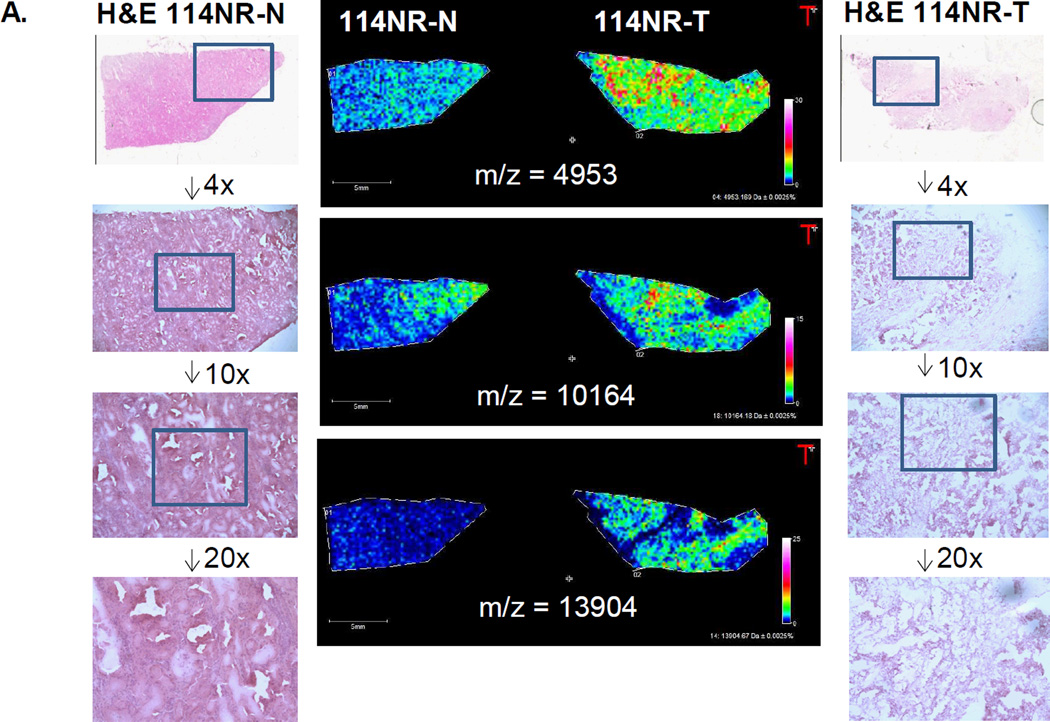
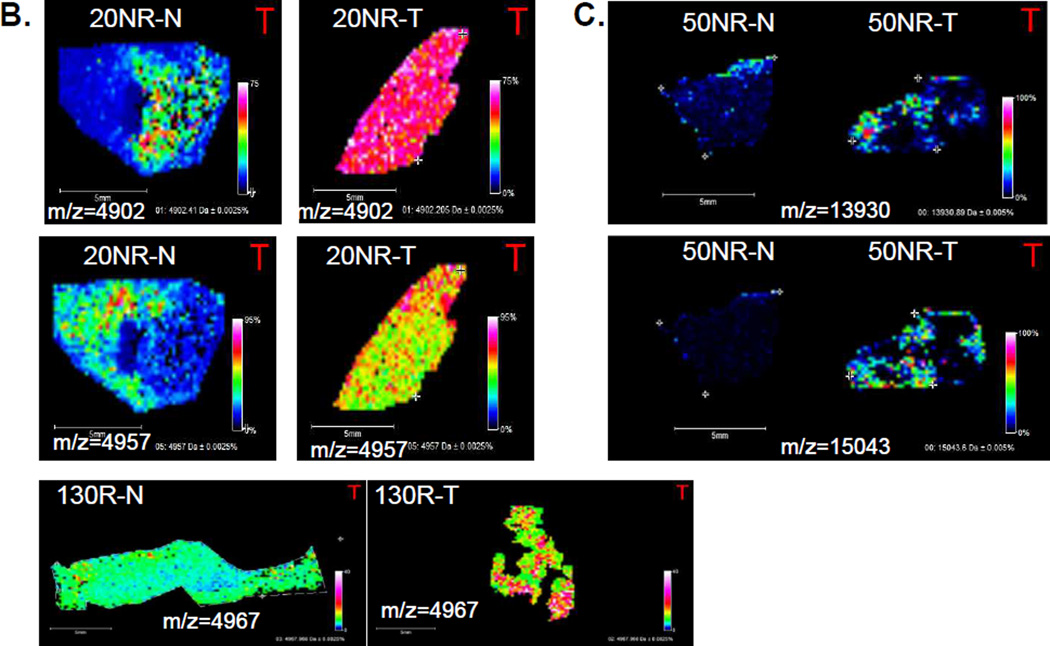
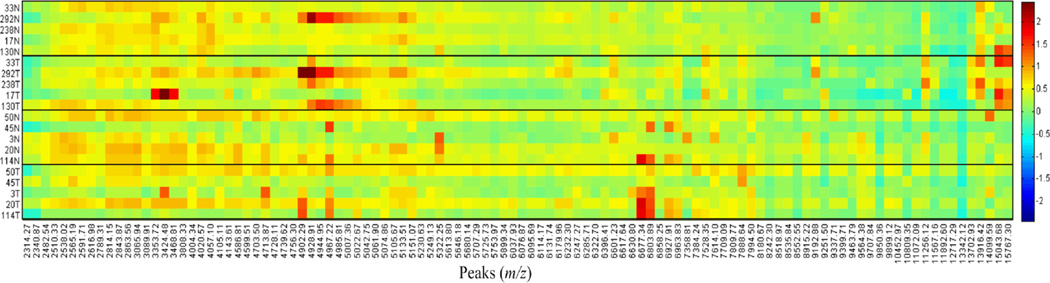
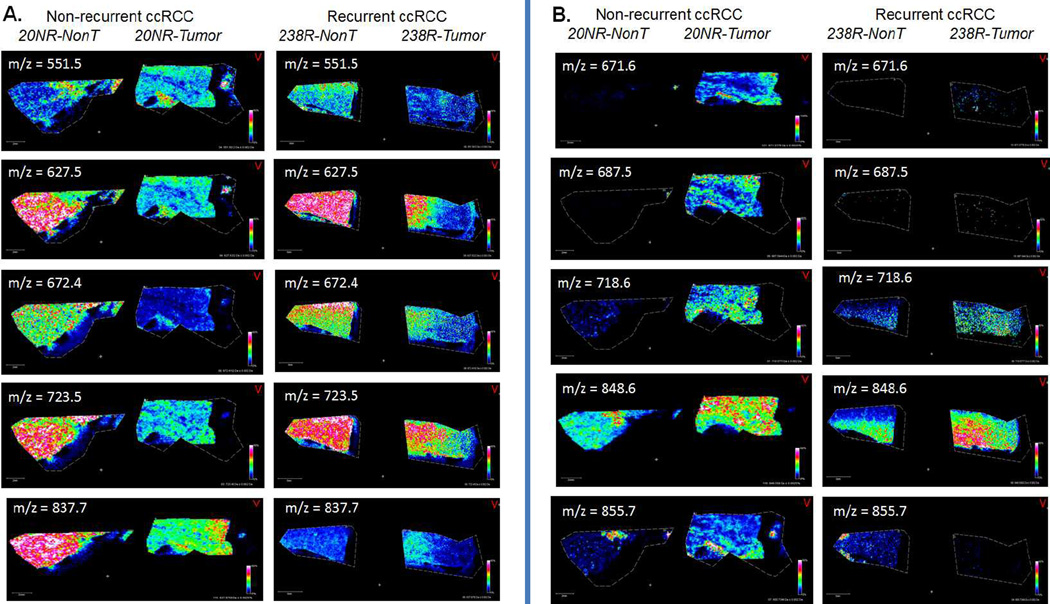
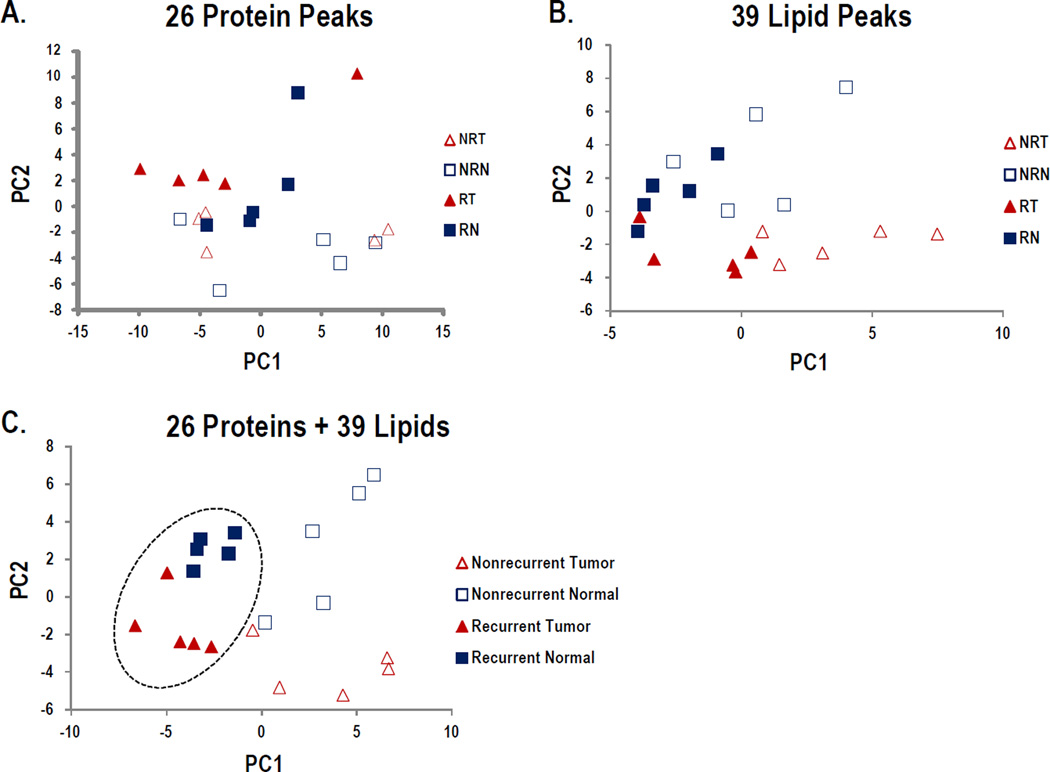
Reducing the incidence and mortality rates for clear cell renal cell carcinoma (ccRCC) remains a significant clinical challenge with poor 5-year survival rates. A unique tissue cohort was assembled of matched ccRCC and distal nontumor tissues (n = 20) associated with moderate risk of disease progression, half of these from individuals who progressed to metastatic disease and the other half who remained disease free. These tissues were used for MALDI imaging MS profiling of proteins in the 2-20 kDa range, resulting in a panel of 108 proteins that had potential disease-specific expression patterns. Protein lysates from the same tissues were analyzed by MS/MS, resulting in identification of 56 proteins of less than 20 kDa molecular weight. The same tissues were also used for global lipid profiling analysis by MALDI-FT-ICR MS. From the cumulative protein and lipid expression profile data, a refined panel of 26 proteins and 39 lipid species was identified that could either distinguish tumor from nontumor tissues, or tissues from recurrent disease progressors from nonrecurrent disease individuals. This approach has the potential to not only improve prognostic assessment and enhance postoperative surveillance, but also to inform on the underlying biology of ccRCC progression.
Keywords: Biomedicine; Lipid profiling; MALDI imaging; MALDI-FT-ICR; Renal cancer; Tissue proteomics.
© 2014 WILEY-VCH Verlag GmbH & Co. KGaA, Weinheim.
Conflict of interest statement
The authors have no conflict of interests to declare.
Figures
Similar articles
-
Histology-guided proteomic analysis to investigate the molecular profiles of clear cell Renal Cell Carcinoma grades.J Proteomics. 2019 Jan 16;191:38-47. doi: 10.1016/j.jprot.2018.04.028. Epub 2018 Apr 23. J Proteomics. 2019. PMID: 29698802
-
Label-free quantitative proteomic analysis reveals potential biomarkers and pathways in renal cell carcinoma.Tumour Biol. 2015 Feb;36(2):939-51. doi: 10.1007/s13277-014-2694-2. Epub 2014 Oct 15. Tumour Biol. 2015. PMID: 25315187
-
Proteomic analysis reveals differentially secreted proteins in the urine from patients with clear cell renal cell carcinoma.Urol Oncol. 2016 Jan;34(1):5.e11-25. doi: 10.1016/j.urolonc.2015.07.016. Epub 2015 Sep 26. Urol Oncol. 2016. PMID: 26420021
-
Differential expression and clinical significance of serum protein among patients with clear-cell renal cell carcinoma.Cancer Biomark. 2015;15(4):485-91. doi: 10.3233/CBM-150490. Cancer Biomark. 2015. PMID: 26406868
-
MALDI mass spectrometry in prostate cancer biomarker discovery.Biochim Biophys Acta. 2014 May;1844(5):940-9. doi: 10.1016/j.bbapap.2013.06.015. Epub 2013 Jul 2. Biochim Biophys Acta. 2014. PMID: 23831156 Review.
Cited by
-
Identification of peptide regions of SERPINA1 and ENOSF1 and their protein expression as potential serum biomarkers for gastric cancer.Tumour Biol. 2015 Jul;36(7):5109-18. doi: 10.1007/s13277-015-3163-2. Epub 2015 Feb 14. Tumour Biol. 2015. PMID: 25677901
-
Metabolomics profiling of methamphetamine addicted human serum and three rat brain areas.RSC Adv. 2019 Dec 12;9(70):41107-41119. doi: 10.1039/c9ra08096a. eCollection 2019 Dec 9. RSC Adv. 2019. PMID: 35540062 Free PMC article.
-
ImShot: An Open-Source Software for Probabilistic Identification of Proteins In Situ and Visualization of Proteomics Data.Mol Cell Proteomics. 2022 Jun;21(6):100242. doi: 10.1016/j.mcpro.2022.100242. Epub 2022 May 13. Mol Cell Proteomics. 2022. PMID: 35569805 Free PMC article.
-
Novel Secondary Ion Mass Spectrometry Methods for the Examination of Metabolic Effects at the Cellular and Subcellular Levels.Front Behav Neurosci. 2020 Jul 20;14:124. doi: 10.3389/fnbeh.2020.00124. eCollection 2020. Front Behav Neurosci. 2020. PMID: 32792922 Free PMC article.
-
Heat fixation inactivates viral and bacterial pathogens and is compatible with downstream MALDI mass spectrometry tissue imaging.BMC Microbiol. 2015 May 13;15:101. doi: 10.1186/s12866-015-0431-7. BMC Microbiol. 2015. PMID: 25966989 Free PMC article.
References
-
- Jemal A, Siegel R, Xu J, Ward E. Cancer statistics, 2010. CA Cancer J Clin. 2010;60:277–300. - PubMed
-
- Moore LE, Wilson RT, Campleman SL. Lifestyle factors, exposures, genetic susceptibility, and renal cell cancer risk: a review. Cancer Invest. 2005;23:240–255. - PubMed
-
- Mourad WF, Dutcher J, Ennis RD. State-of-the-Art Management of Renal Cell Carcinoma. Am J Clin Oncol. 2012 Epub ahead of print. - PubMed
-
- McLaughlin JK, Lipworth L. Epidemiologic aspects of renal cell cancer. Sem Oncol. 2000;27:115–123. - PubMed
Publication types
MeSH terms
Substances
Grants and funding
LinkOut - more resources
Full Text Sources
Other Literature Sources
