. 2014 May 8;123(19):3007-15.
doi: 10.1182/blood-2013-12-544809. Epub 2014 Feb 4.

GATA-3 expression identifies a high-risk subset of PTCL, NOS with distinct molecular and clinical features

Affiliations

GATA-3 expression identifies a high-risk subset of PTCL, NOS with distinct molecular and clinical features

Tianjiao Wang et al. Blood. .

Abstract

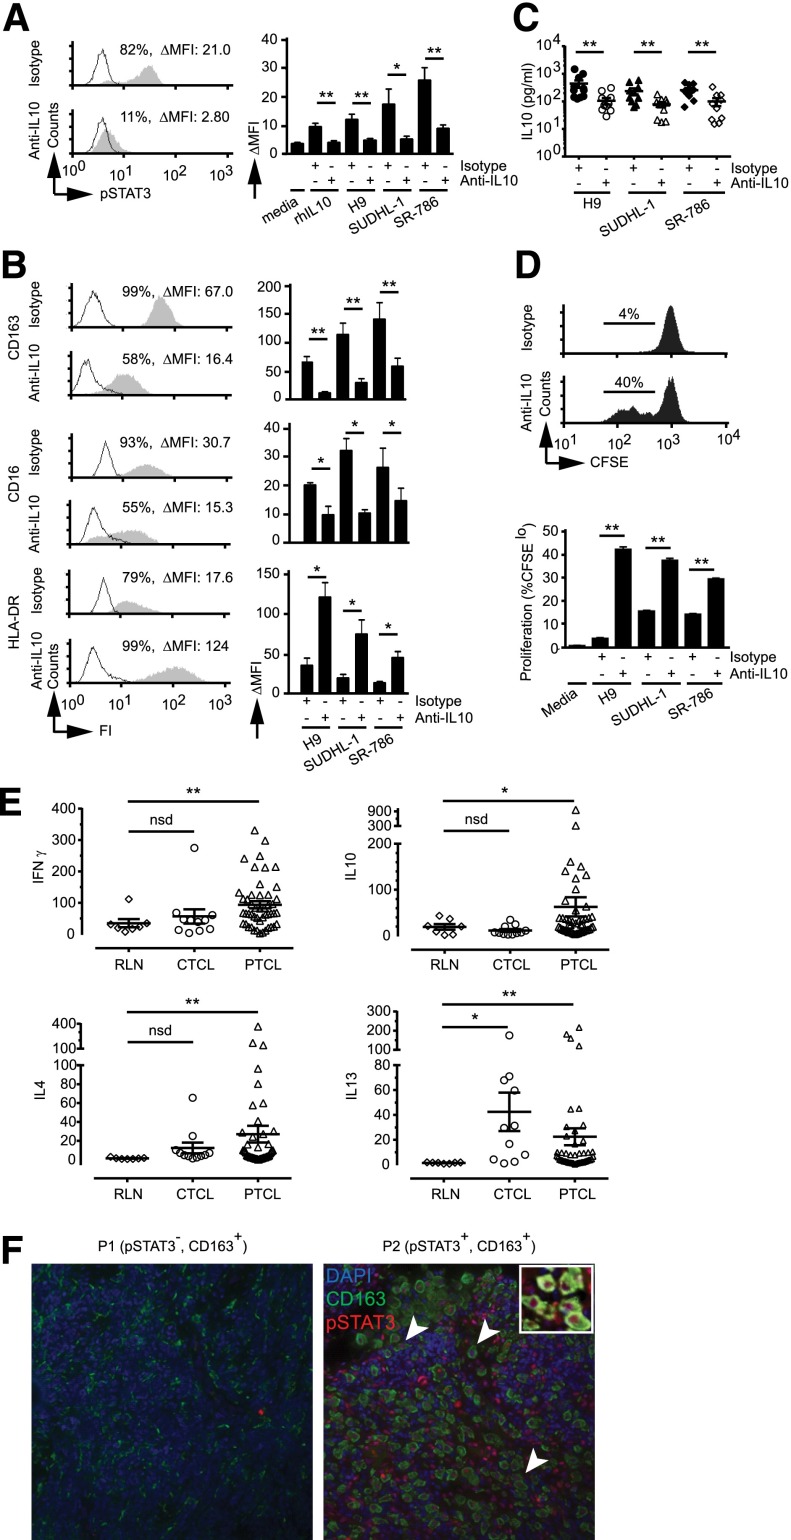
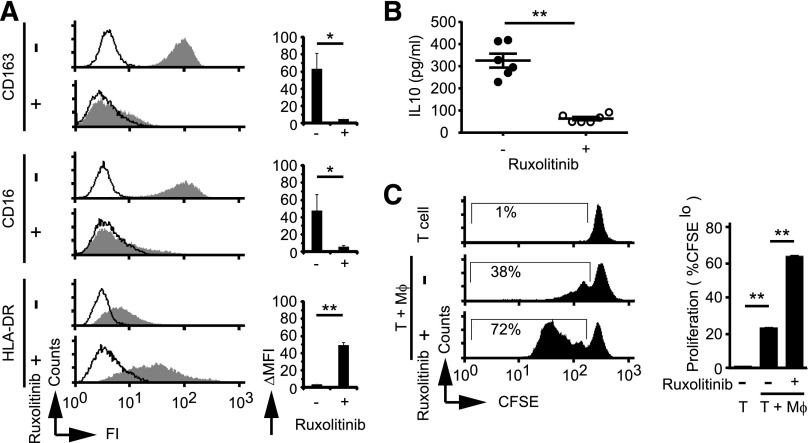
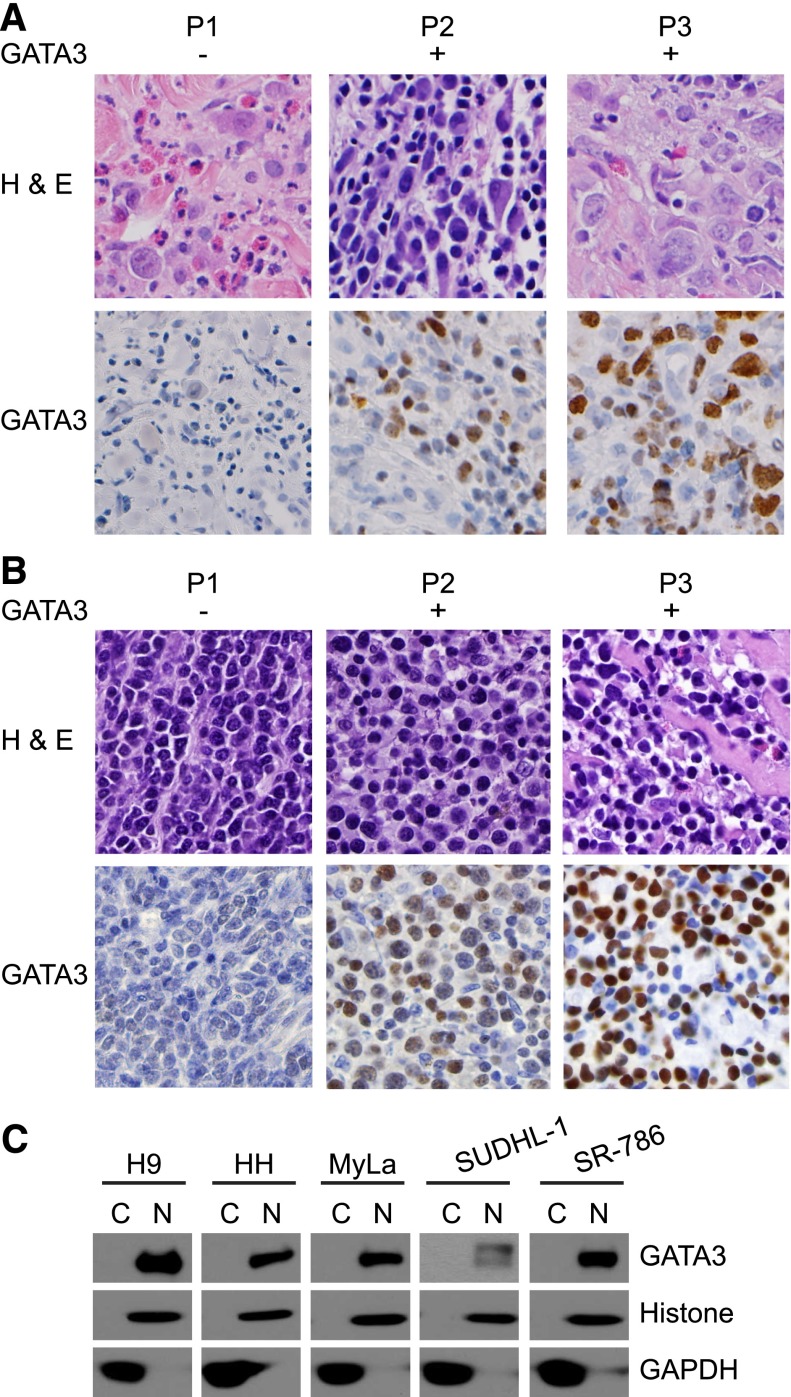
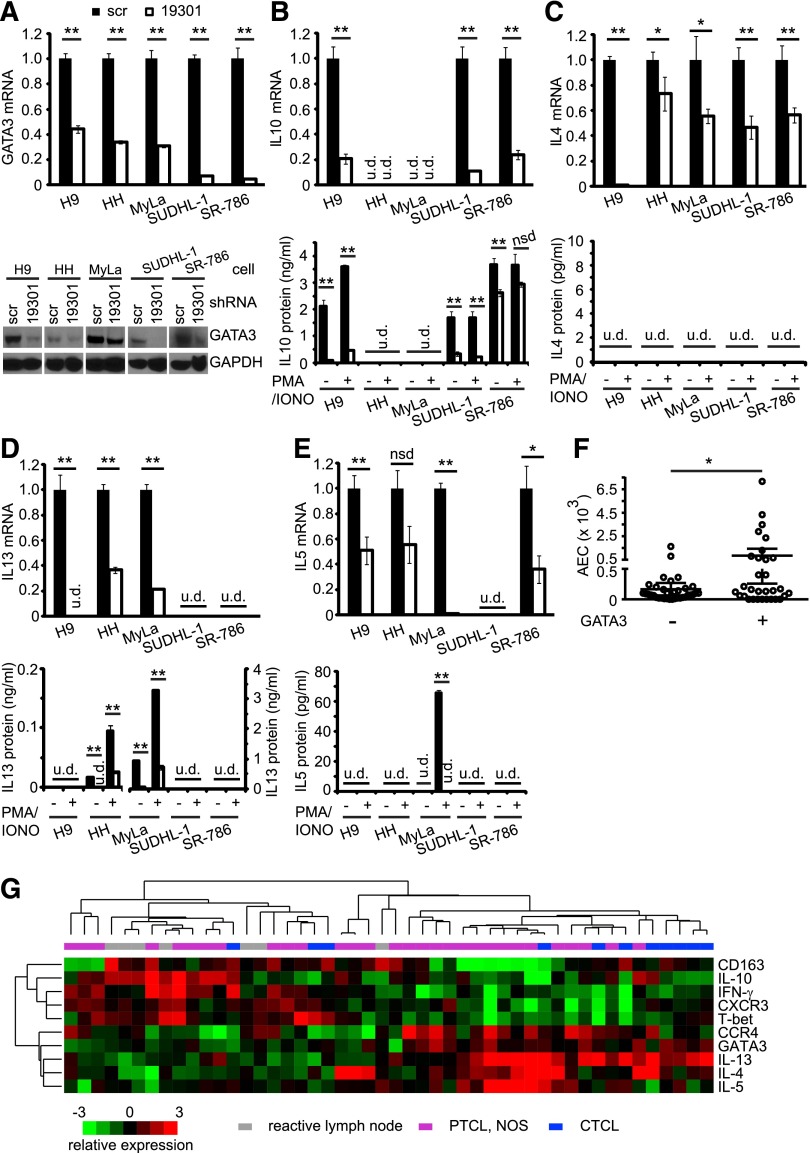
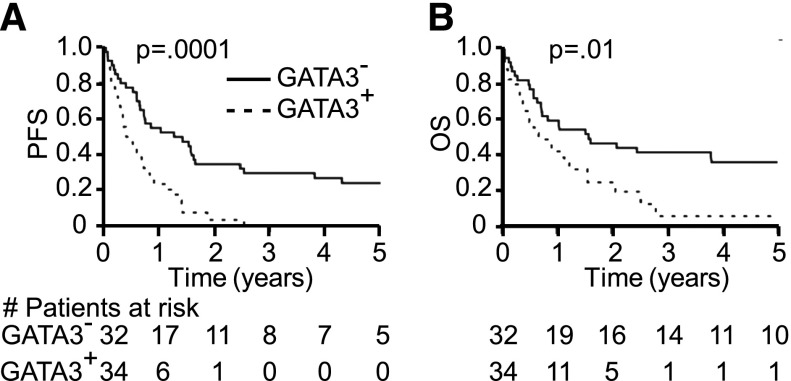
The cell of origin and the tumor microenvironment's role remain elusive for the most common peripheral T-cell lymphomas (PTCLs). As macrophages promote the growth and survival of malignant T cells and are abundant constituents of the tumor microenvironment, their functional polarization was examined in T-cell lymphoproliferative disorders. Cytokines that are abundant within the tumor microenvironment, particularly interleukin (IL)-10, were observed to promote alternative macrophage polarization. Macrophage polarization was signal transducer and activator of transcription 3 dependent and was impaired by the Janus kinase inhibitor ruxolitinib. In conventional T cells, the production of T helper (Th)2-associated cytokines and IL-10, both of which promote alternative macrophage polarization, is regulated by the T-cell transcription factor GATA-binding protein 3 (GATA-3). Therefore, its role in the T-cell lymphomas was examined. GATA-3 expression was observed in 45% of PTCLs, not otherwise specified (PTCL, NOS) and was associated with distinct molecular features, including the production of Th2-associated cytokines. In addition, GATA-3 expression identified a subset of PTCL, NOS with distinct clinical features, including inferior progression-free and overall survival. Collectively, these data suggest that further understanding the cell of origin and lymphocyte ontogeny among the T-cell lymphomas may improve our understanding of the tumor microenvironment's pathogenic role in these aggressive lymphomas.


Figures

Figure 1
Figure 1
IL-10–dependent macrophage polarization and macrophage-polarizing cytokines in TCLs. (A) Monocytes were cultured in media alone or in media supplemented with either IL-10 (20 ng/mL) or conditioned-media (50% v/v) obtained from the TCL cells indicated. An isotype control or neutralizing IL-10 monoclonal antibody was included, as indicated, and STAT3 phosphorylation (Y705) determined by flow cytometry. (Left) Representative histograms (open, isotype control; gray, pSTAT3). (Right) Change in mean fluorescent intensity (ΔMFI) of pSTAT3 from triplicate wells (±standard error). (B) Monocyte-derived macrophages (MDMs) were generated and polarized in TCL-conditioned media with an isotype control or IL-10 neutralizing antibody. CD163, CD16, and HLA-DR expression (gray histogram) were determined (isotype control, open histogram). MDMs generated in the presence of H9-conditioned media are shown in (left) representative histograms and (right) change in mean fluorescent intensity (ΔMFI) from triplicate wells (±standard error). (C) MDMs were generated and functionally polarized in TCL-conditioned media (TCL-CM) supplemented with an isotype control (closed markers) or IL-10 neutralizing monoclonal antibody (open markers) in triplicate in a flat-bottom 96-well plate. Adherent macrophages were gently washed with fresh media, and lipopolysaccharide was added. IL-10 production was determined 24 hours later. The mean (±standard error) from 10 individual normal donors is shown (note logarithmic scale). (D) MDMs were polarized with TCL-CM in triplicate wells of a 96-well plate. CFSE-labeled allogeneic CD3+ T cells were added, and T-cell proliferation determined by CFSE dilution. (Upper) Representative histograms using MDMs generated in H9-CM. (Lower) Mean proliferation (% CFSElo) (±standard error). All experiments shown are representative of ≥3 similarly performed experiments. (E) The abundance of cytokine transcripts (IFN-γ, IL-10, IL-4, IL-13) were quantified by Nanostring nCounter technology from FFPE reactive lymph node (n = 7), CTCL (n = 11), and 48 PTCL (PTCL, NOS, n = 31; AITL, n = 10, ALCL, n = 7) specimens. (F) Immunofluorescent double staining for CD163 and pSTAT3 (Y705) with nuclei stained by 4′6 diamidino-2-phenylindole was performed in PTCL, NOS specimens (n = 80, representative examples shown). *P < .05 and **P < .01 in unpaired 2-sided Student t test.
Figure 2
Figure 2
Ruxolitinib inhibits IL-10–dependent macrophage polarization. (A) MDMs were generated and polarized with IL-10 as before. Cultures were supplemented with vehicle control (dimethylsulfoxide) or ruxolitinib (1 μM), and CD163, CD16, and HLA-DR expression was determined. (B-C) Polarized macrophages generated in the presence or absence of ruxolitinib (Rux) were washed with fresh media. (B) Media supplemented with lipopolysaccharide (100 ng/mL) were added, and cell-free supernatants were collected 24 hours later for determination of IL-10 production by cytometric bead array assay. The mean (±standard error) from 6 individual normal donors is shown. (C) In parallel, CFSE-labeled T cells were added in triplicate, and T-cell proliferation was determined by CFSE dilution. *P < .05 and **P < .01 in unpaired 2-sided Student t test.
Figure 3
Figure 3
GATA-3 expression in T-cell lymphoproliferative disorders. GATA-3 expression was determined by immunohistochemistry in (A) CTCL and (B) PTCL, NOS clinical specimens. Three representative cases (P1-P3) are shown. (C) Cytoplasmic (C) and nuclear (N) fractions were obtained from the patient-derived TCL lines shown, and GATA-3 expression was determined by western blot.
Figure 4
Figure 4
GATA-3–dependent cytokine production in TCLs. (A) GATA-3 expression was determined by (upper) qRT-PCR and (lower) western blot in TCL lines lentivirally transduced with a nonspecific (“scramble”) or GATA-3–specific (“19301”) shRNA. (B) IL-10, (C) IL-4, (D) IL-13, and (E) IL-5 production following GATA-3 knockdown was examined by (upper) qRT-PCR or (lower) enzyme-linked immunosorbent assay. For determination of cytokine production, cells were cultured at the same density in triplicate in 96-well plates in media alone or stimulated with phorbol 12-myristate 13-acetate (50 ng/mL) and ionomycin (iono, 500 ng/mL), and cell free supernatants were collected after a 12- to 24-hour incubation. (F) The absolute eosinophil count at diagnosis is shown in PTCL, NOS patients stratified by GATA-3 expression. (G) Unsupervised clustering of PTCL, NOS (n = 31), CTCL (n = 11), and reactive lymph nodes (RLNs; n = 7) on a panel of Th1-associated (T-bet, IFN-γ, CXCR3) and Th2-associated (GATA-3, IL-4, IL-5, IL-13) transcripts. *P < .05 and P < .01 in unpaired 2-sided Student t test.
Figure 5
Figure 5
GATA-3 expression identifies a subset of PTCL, NOS with inferior survival. Kaplan-Meier estimates of progression-free and overall survival are shown for PTCL, NOS patients stratified by GATA-3 expression (dashed line, GATA-3 positive; solid line, GATA-3 negative).

Comment in

  • Cellular origin of T-cell lymphomas.
    de Leval L, Gaulard P. de Leval L, et al. Blood. 2014 May 8;123(19):2909-10. doi: 10.1182/blood-2014-02-555763. Blood. 2014. PMID: 24810625 No abstract available.

References

    1. Lenz G, Staudt LM. Aggressive lymphomas. N Engl J Med. 2010;362(15):1417–1429. - PMC - PubMed
    1. Dave SS, Wright G, Tan B, et al. Prediction of survival in follicular lymphoma based on molecular features of tumor-infiltrating immune cells. N Engl J Med. 2004;351(21):2159–2169. - PubMed
    1. Steidl C, Lee T, Shah SP, et al. Tumor-associated macrophages and survival in classic Hodgkin’s lymphoma. N Engl J Med. 2010;362(10):875–885. - PMC - PubMed
    1. Wilcox RA. Cancer-associated myeloproliferation: old association, new therapeutic target. Mayo Clin Proc. 2010;85(7):656–663. - PMC - PubMed
    1. Zhu J, Yamane H, Paul WE. Differentiation of effector CD4 T cell populations. Annu Rev Immunol. 2010;28:445–489. - PMC - PubMed

Publication types

MeSH terms