. 2014:3:e01914.
doi: 10.7554/eLife.01914. Epub 2014 Feb 4.

Integrating influenza antigenic dynamics with molecular evolution

Affiliations

Integrating influenza antigenic dynamics with molecular evolution

Trevor Bedford et al. Elife. 2014.

Abstract

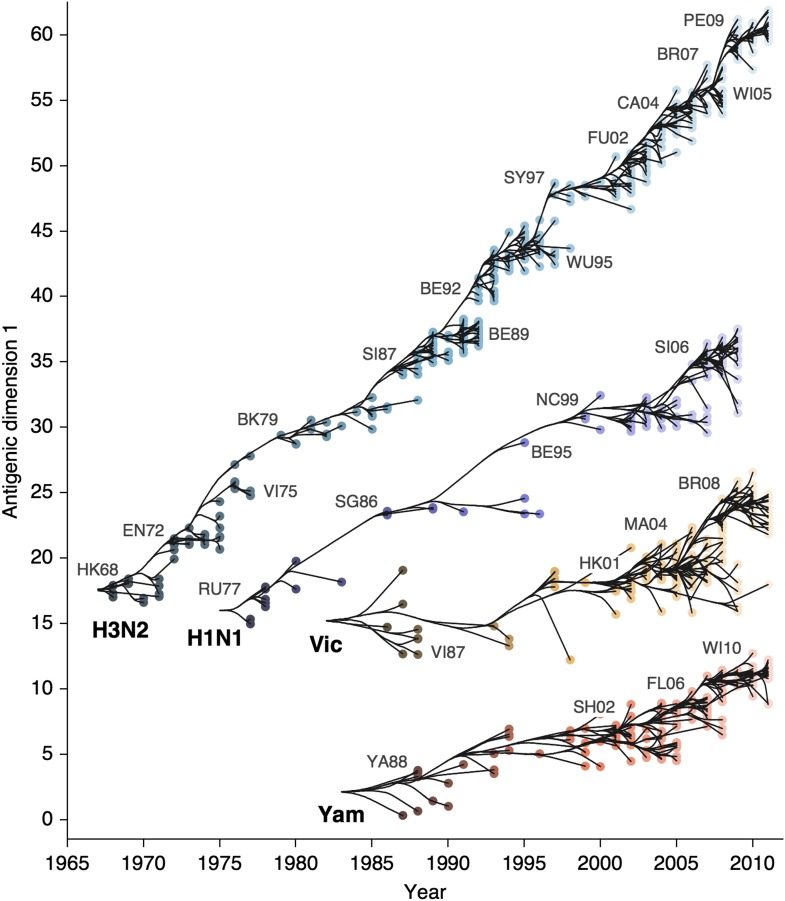
Influenza viruses undergo continual antigenic evolution allowing mutant viruses to evade host immunity acquired to previous virus strains. Antigenic phenotype is often assessed through pairwise measurement of cross-reactivity between influenza strains using the hemagglutination inhibition (HI) assay. Here, we extend previous approaches to antigenic cartography, and simultaneously characterize antigenic and genetic evolution by modeling the diffusion of antigenic phenotype over a shared virus phylogeny. Using HI data from influenza lineages A/H3N2, A/H1N1, B/Victoria and B/Yamagata, we determine patterns of antigenic drift across viral lineages, showing that A/H3N2 evolves faster and in a more punctuated fashion than other influenza lineages. We also show that year-to-year antigenic drift appears to drive incidence patterns within each influenza lineage. This work makes possible substantial future advances in investigating the dynamics of influenza and other antigenically-variable pathogens by providing a model that intimately combines molecular and antigenic evolution. DOI: http://dx.doi.org/10.7554/eLife.01914.001.

Keywords: Bayesian inference; antigenic cartography; evolution; influenza; multidimensional scaling; phylogenetics.


Conflict of interest statement

The authors declare that no competing interests exist.

Figures

Figure 1.
Figure 1.. Pairwise correlations between genetic distance, measured as amino acid mutations or as phylogenetic distance, and antigenic distance for influenza A/H3N2, A/H1N1, B/Vic, and B/Yam.
The top row shows correlations between number of amino acid mutations in HA1 and average antigenic distance between 10,000 random pairs of viruses. The bottom row shows correlations between average phylogenetic distance, measured in terms of years, and average antigenic distance between 10,000 random pairs of viruses. Dashed lines show linear model fits, with R2 and slope noted, while solid lines show LOESS fits. Antigenic distances derive from model 2 of Table 1. DOI: http://dx.doi.org/10.7554/eLife.01914.004
Figure 2.
Figure 2.. Antigenic locations of A/H3N2, A/H1N1, B/Vic, and B/Yam viruses showing evolutionary relationships between virus samples.
Circles represent a posterior sample of virus locations and have been shaded based on year of isolation. Antigenic units represent twofold dilutions of the HI assay. Absolute positioning of lineages, for example A/H3N2 and A/H1N1, is arbitrary. Lines represent mean posterior diffusion paths when virus locations are fixed. Prominent antigenic clusters are labeled after vaccine strains present within clusters, and are abbreviated from Hong Kong/68, England/72, Victoria/75, Bangkok/79, Sichuan/87, Beijing/89, Beijing/92, Wuhan/95, Sydney/97, Fujian/02, California/04, Wisconsin/05, Brisbane/07, Perth/09 (A/H3N2), USSR/77, Singapore/86, Beijing/95, New Caledonia/99, Solomon Islands/06 (H1N1), Victoria/87, Hong Kong/01, Malaysia/04, Brisbane/08 (Vic), Yamagata/88, Shanghai/02, Florida/06, Wisconsin/10 (Yam). DOI: http://dx.doi.org/10.7554/eLife.01914.005
Figure 3.
Figure 3.. Antigenic drift of A/H3N2, A/H1N1, B/Vic and B/Yam viruses showing evolutionary relationships between virus samples.
Antigenic drift is shown in terms of change of location in the first antigenic dimension through time. Circles represent a posterior sample of virus locations and have been shaded based on year of isolation. Antigenic units represent twofold dilutions of the HI assay. Relative positioning of lineages, for example A/H3N2 and A/H1N1, in the vertical axis is arbitrary. Lines represent mean posterior diffusion paths when virus locations are fixed. Prominent antigenic clusters are labeled after vaccine strains present within clusters, and are abbreviated from Hong Kong/68, England/72, Victoria/75, Bangkok/79, Sichuan/87, Beijing/89, Beijing/92, Wuhan/95, Sydney/97, Fujian/02, California/04, Wisconsin/05, Brisbane/07, Perth/09 (A/H3N2), USSR/77, Singapore/86, Beijing/95, New Caledonia/99, Solomon Islands/06 (H1N1), Victoria/87, Hong Kong/01, Malaysia/04, Brisbane/08 (Vic), Yamagata/88, Shanghai/02, Florida/06, Wisconsin/10 (Yam). DOI: http://dx.doi.org/10.7554/eLife.01914.007
Figure 4.
Figure 4.. Time-resolved phylogenetic trees of A/H3N2, A/H1N1, B/Vic and B/Yam viruses.
The maximium-clade credibility (MCC) tree is shown for each virus. These trees show genealogical relationships, so that branches are measured in terms of years rather than substitutions. DOI: http://dx.doi.org/10.7554/eLife.01914.010
Figure 5.
Figure 5.. Year-to-year antigenic drift between 1992 and 2011 in A/H3N2, A/H1N1, B/Vic and B/Yam viruses.
(A) Timeseries of year-to-year antigenic drift between 1992 and 2011 in A/H3N2, A/H1N1, B/Vic and B/Yam viruses. Colored lines represent year-to-year antigenic drift, where drift for year i is measured as the mean of antigenic dimension 1 of phylogenetic lineages in year i compared to the mean of antigenic dimension 1 of phylogenetic lineages from the previous year i − 1. For example, 2000 represents difference in antigenic dimension 1 between viruses from 1999 to 2000. Error bars represent 50% Bayesian credible intervals of year-to-year drift. Gray dotted lines represent lineage-specific seasonal incidence in the USA taken as average influenza-like illness (ILI) multiplied by proportion of viruses attributable to a lineage for each season. Here, 2000 represents the 2000/2001 influenza season. (B) Distribution of year-to-year antigenic drift between 1992 and 2011 in A/H3N2, A/H1N1, B/Vic and B/Yam viruses. DOI: http://dx.doi.org/10.7554/eLife.01914.011
Figure 6.
Figure 6.. Relationship between antigenic drift and seasonal incidence for years 1998 to 2009 in influenza A/H3N2, A/H1N1, B/Vic and B/Yam.
Antigenic drift from year i − 1 to year i is compared to incidence in the season i/i + 1. For example, year-to-year antigenic drift from 2000 to 2001 is measured against incidence in the 2001/2002 season. DOI: http://dx.doi.org/10.7554/eLife.01914.012
Figure 7.
Figure 7.. Relationship between antigenic drift and sample counts for years 1998 to 2011 in influenza A/H3N2, A/H1N1, B/Vic and B/Yam.
Antigenic drift from year i − 1 to year i is compared to the ratio of sample counts in year i to counts in year i − 1. Only comparisons which had one or more samples in years i − 1 and i were retained, leaving 11 A/H3N2, 7 A/H1N1, 9 B/Vic and 10 B/Yam comparisons. Points are colored according to influenza lineage based on the color scheme in Figure 6. DOI: http://dx.doi.org/10.7554/eLife.01914.013
Figure 8.
Figure 8.. Likelihood of HI titers in the BMDS model.
Here, we show the likelihoods of observing three different outcomes given δij=4, φ=0.95, and sj=log2(1280)=10.32. The likelihood of observing a threshold titer of ‘<40’ is equal to the lower tail of the probability density function f(5.32)=0.146. The likelihood of observing a point measurement with an exact inhibiting titer of ‘90.5’ is equal to the density function f|(6.5)=0.413. The likelihood of observing an interval measurement with an inhibiting titer somewhere between ‘160’ and ‘320’ is equal to f(7.32)=0.129. DOI: http://dx.doi.org/10.7554/eLife.01914.014
Figure 9.
Figure 9.. Schematic antigenic map with three viruses and two sera.
(A) Map with virus 1 and virus 3 antigenically similar. (B) Map with virus 1 and virus 3 antigenically divergent. Virus 1 is shown in blue, virus 2 is shown in red and virus 3 is shown in yellow. Virus isolates are represented by filled circles, sera raised against viruses are shown as open circles and map distances δij are shown as solid lines connecting viruses and sera. Sera from virus 1 is compared against viruses 1 and 2, while sera from virus 2 is compared against viruses 2 and 3. Configurations (A) and (B) represent cartographic models that would give equal likelihoods to a set of serological data {H11,H21,H22,H32}. DOI: http://dx.doi.org/10.7554/eLife.01914.015
Figure 10.
Figure 10.. Comparison of A/H3N2 antigenic locations estimated by Smith et al. (2004) using MDS and an equivalent BMDS model.
(A) MDS antigenic locations, reoriented so that the primary dimension lies on the x-axis rather than on the y-axis as in Figure 1 of Smith et al. (2004). (B) A posterior sample of antigenic locations from an equivalent BMDS model. In (A) and (B), viruses are shown as colored circles, with color denoting antigenic cluster inferred by (Smith et al., 2004), and sera are shown as gray points. (C) Antigenic distances between A/Bilthoven/16,190/1968 and all other viruses determined for both methods. (D) Antigenic distances between A/Fujian/411/2002 and all other viruses determined for both methods. (E) Antigenic distances between 750 random pairs of viruses determined for both methods. In (C), (D) and (E) red points show distances for the MDS model and gray bars show the 95% credible interval of distances for the BMDS model, while the red dashed line shows a LOESS regression to MDS distances, and the black dashed line shows a LOESS regression to the BMDS distances. The BMDS model has a Uniform (−100, 100) prior on antigenic locations and serum potencies fixed at maximum titer values. DOI: http://dx.doi.org/10.7554/eLife.01914.016
Figure 11.
Figure 11.. Comparison of A/H3N2 antigenic locations estimated by Smith et al. (2004) using MDS and an equivalent BMDS model under an alternative solution.
(A) MDS antigenic locations, reoriented so that the primary dimension lies on the x-axis rather than on the y-axis as in Figure 1 of Smith et al. (2004). (B) A posterior sample of antigenic locations from an equivalent BMDS model that has converged on the alternative solution. In (A) and (B), viruses are shown as colored circles, with color denoting antigenic cluster inferred by Smith et al. (2004), and sera are shown as gray points. (C) Antigenic distances between A/Bilthoven/16,190/1968 and all other viruses determined for both methods. (D) Antigenic distances between A/Fujian/411/2002 and all other viruses determined for both methods. (E) Antigenic distances between 750 random pairs of viruses determined for both methods. In (C), (D) and (E) red points show distances for the MDS model and gray bars show the 95% credible interval of distances for the BMDS model, while the red dashed line shows a LOESS regression to MDS distances, and the black dashed line shows a LOESS regression to the BMDS distances. The BMDS model has a Uniform (−100, 100) prior on antigenic locations and serum potencies fixed at maximum titer values. DOI: http://dx.doi.org/10.7554/eLife.01914.018
Figure 12.
Figure 12.. Comparison of A/H3N2 antigenic locations estimated by Smith et al. (2004) using MDS and an extended BMDS model that includes date-informed priors on antigenic locations.
(A) MDS antigenic locations, reoriented so that the primary dimension lies on the x-axis rather than on the y-axis as in Figure 1 of Smith et al. (2004). (B) A posterior sample of antigenic locations from a BMDS model that includes date-informed priors on antigenic locations. In (A) and (B), viruses are shown as colored circles, with color denoting antigenic cluster inferred by Smith et al. (2004), and sera are shown as gray points. (C) Antigenic distances between A/Bilthoven/16,190/1968 and all other viruses determined for both methods. (D) Antigenic distances between A/Fujian/411/2002 and all other viruses determined for both methods. (E) Antigenic distances between 750 random pairs of viruses determined for both methods. In (C), (D) and (E) red points show distances for the MDS model and gray bars show the 95% credible interval of distances for the BMDS model, while the red dashed line shows a LOESS regression to MDS distances, and the black dashed line shows a LOESS regression to the BMDS distances. The BMDS model has a date-informed prior on antigenic locations and serum potencies fixed at maximum titer values. DOI: http://dx.doi.org/10.7554/eLife.01914.020
Figure 13.
Figure 13.. Comparison of A/H3N2 antigenic locations estimated by Smith et al. (2004) using MDS and an extended BMDS model that estimates serum and virus avidities.
(A) MDS antigenic locations, reoriented so that the primary dimension lies on the x-axis rather than on the y-axis as in Figure 1 of Smith et al. (2004). (B) A posterior sample of antigenic locations from a BMDS model that estimates virus avidity and serum potency. In (A) and (B), viruses are shown as colored circles, with color denoting antigenic cluster inferred by Smith et al. (2004), and sera are shown as gray points. (C) Antigenic distances between A/Bilthoven/16,190/1968 and all other viruses determined for both methods. (D) Antigenic distances between A/Fujian/411/2002 and all other viruses determined for both methods. (E) Antigenic distances between 750 random pairs of viruses determined for both methods. In (C), (D), and (E) red points show distances for the MDS model and gray bars show the 95% credible interval of distances for the BMDS model, while the red dashed line shows a LOESS regression to MDS distances, and the black dashed line shows a LOESS regression to the BMDS distances. The BMDS model has a Uniform (−100, 100) prior on antigenic locations and virus avidities and serum potencies estimated in a hierarchical Bayesian fashion. DOI: http://dx.doi.org/10.7554/eLife.01914.022

References

    1. Abed Y, Coulthart MB, Li Y, Boivin G. 2003. Evolution of surface and nonstructural-1 genes of influenza B viruses isolated in the province of Quebec, Canada, during the 1998–2001 period. Virus Genes 27:125–135. 10.1023/A:1025768308631 - DOI - PubMed
    1. Ansaldi F, D’Agaro P, de Florentiis D, Puzelli S, Lin YP, Gregory V, Bennett M, Donatelli I, Gasparini R, Crovari P, Hay A, Campello C. 2003. Molecular characterization of influenza B viruses circulating in northern Italy during the 2001–2002 epidemic season. Journal of Medical Virology 70:463–469. 10.1002/jmv.10418 - DOI - PubMed
    1. Ansaldi F, Bacilieri S, Amicizia D, Valle L, Banfi F, Durando P, Sticchi L, Gasparini R, Icardi G, Crovari P. 2004. Antigenic characterisation of influenza B virus with a new microneutralisation assay: comparison to haemagglutination and sequence analysis. Journal of Medical Virology 74:141–146. 10.1002/jmv.20157 - DOI - PubMed
    1. Barr I, Komadina N, Durrant C, Sjogren H, Hurt A, Shaw RP. 2006. Circulation and antigenic drift in human influenza B viruses in SE Asia and Oceania since 2000. Communicable diseases intelligence 30:350–357 - PubMed
    1. Barr I McCauley J Cox N Daniels R Engelhardt O Fukuda K Grohmann G Hay A Kelso A Klimov A Odagiri T Smith D Russell C Tashiro M Webby R Wood J Ye Z Zhang W, Writing Committee of the World Health Organization Consultation on Northern Hemisphere Influenza Vaccine Composition for 2009-2010 . 2010. Epidemiological, antigenic and genetic characteristics of seasonal influenza A (H1N1), A (H3N2) and B influenza viruses: basis for the WHO recommendation on the composition of influenza vaccines for use in the 2009-2010 Northern Hemisphere season. Vaccine 28:1156–1167. 10.1016/j.vaccine.2009.11.043 - DOI - PubMed

Publication types

MeSH terms