A role for mitochondrial phosphoenolpyruvate carboxykinase (PEPCK-M) in the regulation of hepatic gluconeogenesis
- PMID: 24497630
- PMCID: PMC3953244
- DOI: 10.1074/jbc.C113.544759
A role for mitochondrial phosphoenolpyruvate carboxykinase (PEPCK-M) in the regulation of hepatic gluconeogenesis
Abstract
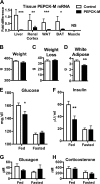
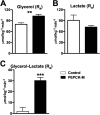
Synthesis of phosphoenolpyruvate (PEP) from oxaloacetate is an absolute requirement for gluconeogenesis from mitochondrial substrates. Generally, this reaction has solely been attributed to the cytosolic isoform of PEPCK (PEPCK-C), although loss of the mitochondrial isoform (PEPCK-M) has never been assessed. Despite catalyzing the same reaction, to date the only significant role reported in mammals for the mitochondrial isoform is as a glucose sensor necessary for insulin secretion. We hypothesized that this nutrient-sensing mitochondrial GTP-dependent pathway contributes importantly to gluconeogenesis. PEPCK-M was acutely silenced in gluconeogenic tissues of rats using antisense oligonucleotides both in vivo and in isolated hepatocytes. Silencing PEPCK-M lowers plasma glucose, insulin, and triglycerides, reduces white adipose, and depletes hepatic glycogen, but raises lactate. There is a switch of gluconeogenic substrate preference to glycerol that quantitatively accounts for a third of glucose production. In contrast to the severe mitochondrial deficiency characteristic of PEPCK-C knock-out livers, hepatocytes from PEPCK-M-deficient livers maintained normal oxidative function. Consistent with its predicted role, gluconeogenesis rates from hepatocytes lacking PEPCK-M are severely reduced for lactate, alanine, and glutamine, but not for pyruvate and glycerol. Thus, PEPCK-M has a direct role in fasted and fed glucose homeostasis, and this mitochondrial GTP-dependent pathway should be reconsidered for its involvement in both normal and diabetic metabolism.
Keywords: Diabetes; GTPase; Gluconeogenesis; Glyceroneogenesis; Intermediary Metabolism; Metabolic Regulation; Metabolic Tracers; Metabolism; Mitochondrial Metabolism; Phosphoenolpyruvate Carboxykinase.
Figures


Similar articles
-
The mitochondrial isoform of phosphoenolpyruvate carboxykinase (PEPCK-M) and glucose homeostasis: has it been overlooked?Biochim Biophys Acta. 2014 Apr;1840(4):1313-30. doi: 10.1016/j.bbagen.2013.10.033. Epub 2013 Oct 28. Biochim Biophys Acta. 2014. PMID: 24177027 Free PMC article. Review.
-
PEPCK-M expression in mouse liver potentiates, not replaces, PEPCK-C mediated gluconeogenesis.J Hepatol. 2013 Jul;59(1):105-13. doi: 10.1016/j.jhep.2013.02.020. Epub 2013 Mar 4. J Hepatol. 2013. PMID: 23466304 Free PMC article.
-
Phosphoenolpyruvate cycling via mitochondrial phosphoenolpyruvate carboxykinase links anaplerosis and mitochondrial GTP with insulin secretion.J Biol Chem. 2009 Sep 25;284(39):26578-90. doi: 10.1074/jbc.M109.011775. Epub 2009 Jul 27. J Biol Chem. 2009. PMID: 19635791 Free PMC article.
-
Phenobarbital reduces blood glucose and gluconeogenesis through down-regulation of phosphoenolpyruvate carboxykinase (GTP) gene expression in rats.Biochem Biophys Res Commun. 2015 Oct 23;466(3):306-11. doi: 10.1016/j.bbrc.2015.09.010. Epub 2015 Sep 5. Biochem Biophys Res Commun. 2015. PMID: 26348778
-
Gluconeogenesis in dairy cows: the secret of making sweet milk from sour dough.IUBMB Life. 2010 Dec;62(12):869-77. doi: 10.1002/iub.400. IUBMB Life. 2010. PMID: 21171012 Review.
Cited by
-
Gluconeogenesis in the extraembryonic yolk syncytial layer of the zebrafish embryo.PNAS Nexus. 2024 Mar 21;3(4):pgae125. doi: 10.1093/pnasnexus/pgae125. eCollection 2024 Apr. PNAS Nexus. 2024. PMID: 38585339 Free PMC article.
-
Wnt regulates amino acid transporter Slc7a5 and so constrains the integrated stress response in mouse embryos.EMBO Rep. 2020 Jan 7;21(1):e48469. doi: 10.15252/embr.201948469. Epub 2019 Dec 2. EMBO Rep. 2020. PMID: 31789450 Free PMC article.
-
Paternal chronic folate supplementation induced the transgenerational inheritance of acquired developmental and metabolic changes in chickens.Proc Biol Sci. 2019 Sep 11;286(1910):20191653. doi: 10.1098/rspb.2019.1653. Epub 2019 Sep 11. Proc Biol Sci. 2019. PMID: 31506054 Free PMC article.
-
Rapid immunopurification of mitochondria for metabolite profiling and absolute quantification of matrix metabolites.Nat Protoc. 2017 Oct;12(10):2215-2231. doi: 10.1038/nprot.2017.104. Epub 2017 Sep 29. Nat Protoc. 2017. PMID: 29532801 Free PMC article.
-
Multitissue 2H/13C flux analysis reveals reciprocal upregulation of renal gluconeogenesis in hepatic PEPCK-C-knockout mice.JCI Insight. 2021 Jun 22;6(12):e149278. doi: 10.1172/jci.insight.149278. JCI Insight. 2021. PMID: 34156032 Free PMC article.
References
-
- Gastaldelli A., Miyazaki Y., Pettiti M., Buzzigoli E., Mahankali S., Ferrannini E., DeFronzo R. A. (2004) Separate contribution of diabetes, total fat mass, and fat topography to glucose production, gluconeogenesis, and glycogenolysis. J. Clin. Endocrinol. Metab. 89, 3914–3921 - PubMed
-
- Maggs D. G., Buchanan T. A., Burant C. F., Cline G., Gumbiner B., Hsueh W. A., Inzucchi S., Kelley D., Nolan J., Olefsky J. M., Polonsky K. S., Silver D., Valiquett T. R., Shulman G. I. (1998) Metabolic effects of troglitazone monotherapy in type 2 diabetes mellitus. A randomized, double-blind, placebo-controlled trial. Ann. Intern. Med. 128, 176–185 - PubMed
-
- Owen O. E., Kalhan S. C., Hanson R. W. (2002) The key role of anaplerosis and cataplerosis for citric acid cycle function. J. Biol. Chem. 277, 30409–30412 - PubMed
Publication types
MeSH terms
Substances
Grants and funding
- R24 DK-085638/DK/NIDDK NIH HHS/United States
- R01 DK-40936/DK/NIDDK NIH HHS/United States
- P30 DK079310/DK/NIDDK NIH HHS/United States
- P30 DK45735/DK/NIDDK NIH HHS/United States
- U24 DK059635/DK/NIDDK NIH HHS/United States
- R01 DK040936/DK/NIDDK NIH HHS/United States
- R24 DK085638/DK/NIDDK NIH HHS/United States
- P30 DK79310-01/DK/NIDDK NIH HHS/United States
- U24 DK-059635/DK/NIDDK NIH HHS/United States
- P30 DK034989/DK/NIDDK NIH HHS/United States
- K08 DK080142/DK/NIDDK NIH HHS/United States
- HHMI/Howard Hughes Medical Institute/United States
- P30 DK34989/DK/NIDDK NIH HHS/United States
- P30 DK045735/DK/NIDDK NIH HHS/United States
- R01 DK092606/DK/NIDDK NIH HHS/United States
LinkOut - more resources
Full Text Sources
Other Literature Sources
Molecular Biology Databases
Miscellaneous

