

Affinity map of bromodomain protein 4 (BRD4) interactions with the histone H4 tail and the small molecule inhibitor JQ1
- PMID: 24497639
- PMCID: PMC3979416
- DOI: 10.1074/jbc.M113.523019
Affinity map of bromodomain protein 4 (BRD4) interactions with the histone H4 tail and the small molecule inhibitor JQ1
Abstract
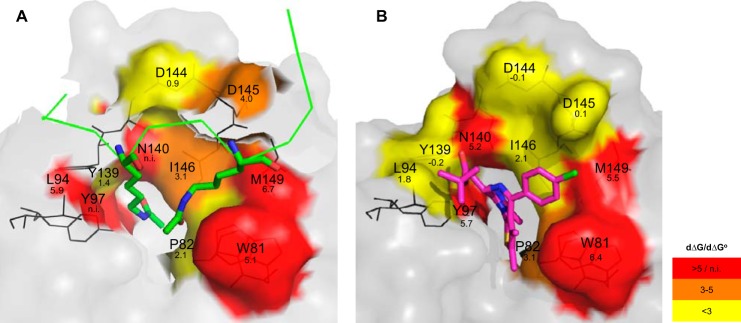
Bromodomain protein 4 (BRD4) is a member of the bromodomain and extra-terminal domain (BET) protein family. It binds to acetylated histone tails via its tandem bromodomains BD1 and BD2 and forms a complex with the positive transcription elongation factor b, which controls phosphorylation of RNA polymerase II, ultimately leading to stimulation of transcription elongation. An essential role of BRD4 in cell proliferation and cancer growth has been reported in several recent studies. We analyzed the binding of BRD4 BD1 and BD2 to different partners and showed that the strongest interactions took place with di- and tetra-acetylated peptides derived from the histone 4 N-terminal tail. We also found that several histone 4 residues neighboring the acetylated lysines significantly influenced binding. We generated 10 different BRD4 BD1 mutants and analyzed their affinities to acetylated histone tails and to the BET inhibitor JQ1 using several complementary biochemical and biophysical methods. The impact of these mutations was confirmed in a cellular environment. Altogether, the results show that Trp-81, Tyr-97, Asn-140, and Met-149 play similarly important roles in the recognition of acetylated histones and JQ1. Pro-82, Leu-94, Asp-145, and Ile-146 have a more differentiated role, suggesting that different kinds of interactions take place and that resistance mutations compatible with BRD4 function are possible. Our study extends the knowledge on the contribution of individual BRD4 amino acids to histone and JQ1 binding and may help in the design of new BET antagonists with improved pharmacological properties.
Keywords: Acetylation; Anticancer Drug; BET Family; BRD4; Bromodomain; Cancer Therapy; Chromatin; Histones; Mutant.
Figures


Similar articles
-
Discovery and characterization of bromodomain 2-specific inhibitors of BRDT.Proc Natl Acad Sci U S A. 2021 Mar 2;118(9):e2021102118. doi: 10.1073/pnas.2021102118. Proc Natl Acad Sci U S A. 2021. PMID: 33637650 Free PMC article.
-
Metabolically Derived Lysine Acylations and Neighboring Modifications Tune the Binding of the BET Bromodomains to Histone H4.Biochemistry. 2017 Oct 17;56(41):5485-5495. doi: 10.1021/acs.biochem.7b00595. Epub 2017 Oct 5. Biochemistry. 2017. PMID: 28945351 Free PMC article.
-
Structural basis and binding properties of the second bromodomain of Brd4 with acetylated histone tails.Biochemistry. 2008 Jun 17;47(24):6403-17. doi: 10.1021/bi8001659. Epub 2008 May 24. Biochemistry. 2008. PMID: 18500820
-
An Overview on Small Molecule Inhibitors of BRD4.Mini Rev Med Chem. 2016;16(17):1403-1414. doi: 10.2174/1389557516666160611014130. Mini Rev Med Chem. 2016. PMID: 27290915 Review.
-
Bromodomains: Structure, function and pharmacology of inhibition.Biochem Pharmacol. 2016 Apr 15;106:1-18. doi: 10.1016/j.bcp.2015.12.005. Epub 2015 Dec 18. Biochem Pharmacol. 2016. PMID: 26707800 Review.
Cited by
-
Interactive enhancer hubs (iHUBs) mediate transcriptional reprogramming and adaptive resistance in pancreatic cancer.Gut. 2023 Jun;72(6):1174-1185. doi: 10.1136/gutjnl-2022-328154. Epub 2023 Mar 8. Gut. 2023. PMID: 36889906 Free PMC article.
-
Discovery of potent and selective BRD4 inhibitors capable of blocking TLR3-induced acute airway inflammation.Eur J Med Chem. 2018 May 10;151:450-461. doi: 10.1016/j.ejmech.2018.04.006. Epub 2018 Apr 3. Eur J Med Chem. 2018. PMID: 29649741 Free PMC article.
-
A Bead-Based Proximity Assay for BRD4 Ligand Discovery.Curr Protoc Chem Biol. 2015 Dec 2;7(4):263-278. doi: 10.1002/9780470559277.ch150024. Curr Protoc Chem Biol. 2015. PMID: 26629616 Free PMC article.
-
Histone H4 acetylation and the epigenetic reader Brd4 are critical regulators of pluripotency in embryonic stem cells.BMC Genomics. 2016 Feb 4;17:95. doi: 10.1186/s12864-016-2414-y. BMC Genomics. 2016. PMID: 26847871 Free PMC article.
-
Multivalent nucleosome scaffolding by bromodomain and extraterminal domain tandem bromodomains.J Biol Chem. 2025 Mar;301(3):108289. doi: 10.1016/j.jbc.2025.108289. Epub 2025 Feb 10. J Biol Chem. 2025. PMID: 39938804 Free PMC article.
References
-
- Berger S. L. (2007) The complex language of chromatin regulation during transcription. Nature 447, 407–412 - PubMed
-
- Zeng L., Zhou M. M. (2002) Bromodomain. An acetyl-lysine binding domain. FEBS Lett. 513, 124–128 - PubMed
-
- Filippakopoulos P., Picaud S., Mangos M., Keates T., Lambert J. P., Barsyte-Lovejoy D., Felletar I., Volkmer R., Müller S., Pawson T., Gingras A. C., Arrowsmith C. H., Knapp S. (2012) Histone recognition and large-scale structural analysis of the human bromodomain family. Cell 149, 214–231 - PMC - PubMed
-
- Florence B., Faller D. V. (2001) You bet-cha. A novel family of transcriptional regulators. Front Biosci. 6, D1008–D1018 - PubMed
Publication types
MeSH terms
Substances
Grants and funding
LinkOut - more resources
Full Text Sources
Other Literature Sources
Chemical Information
Miscellaneous
