. 2014 Jan 17;53(6):10.1117/1.OE.53.6.061707.
doi: 10.1117/1.OE.53.6.061707.

Impact of high power and angle of incidence on prism corrections for visual field loss

Affiliations

Impact of high power and angle of incidence on prism corrections for visual field loss

Jae-Hyun Jung et al. Opt Eng. .

Abstract

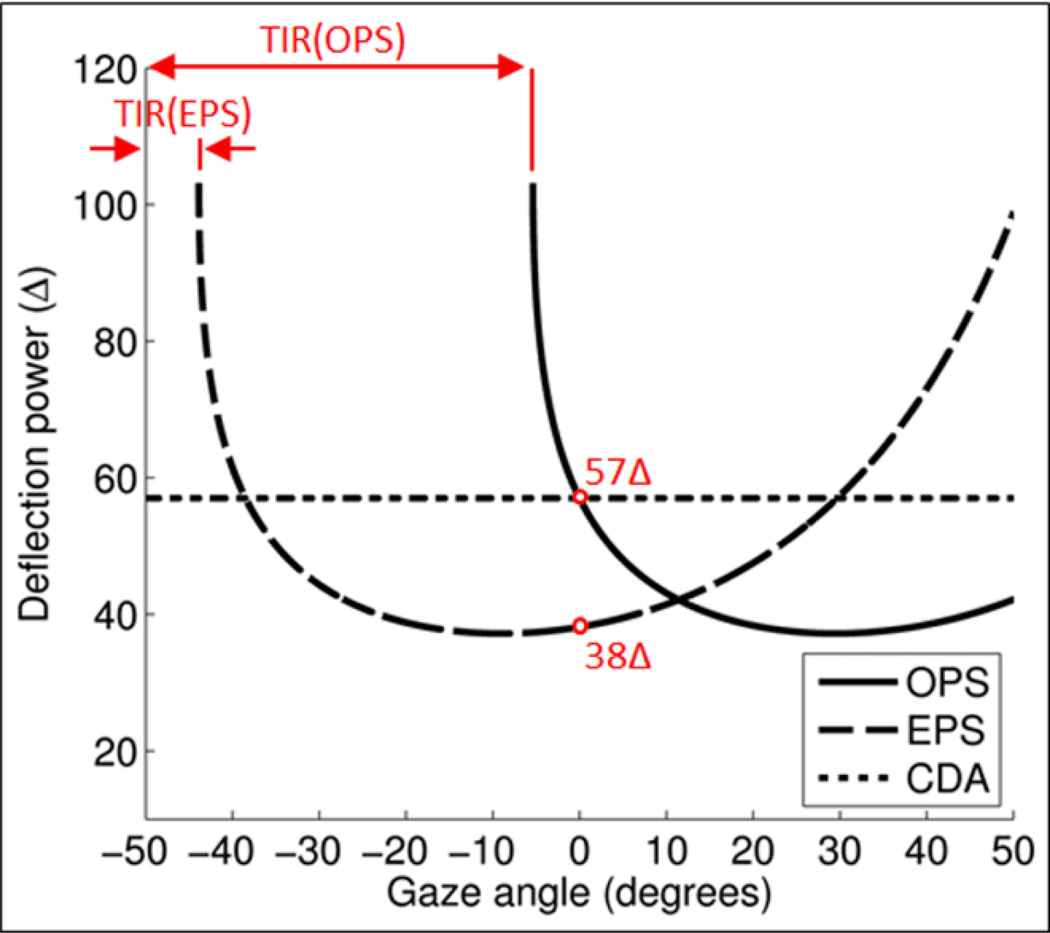
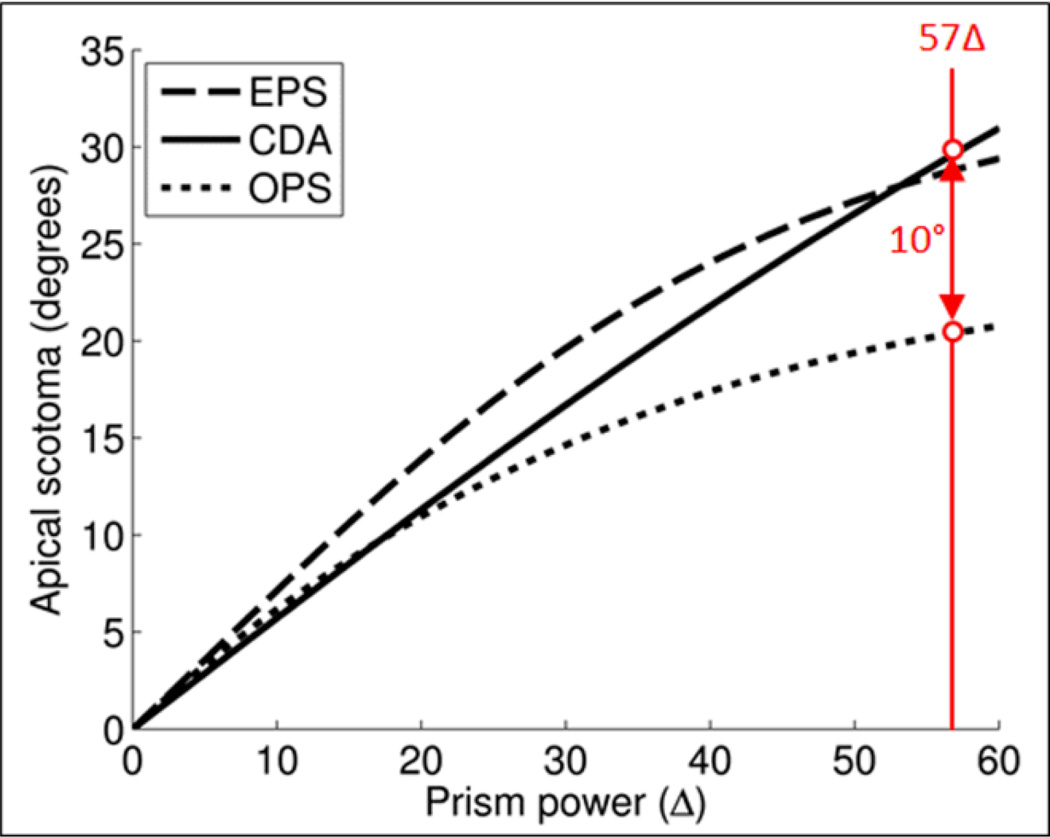
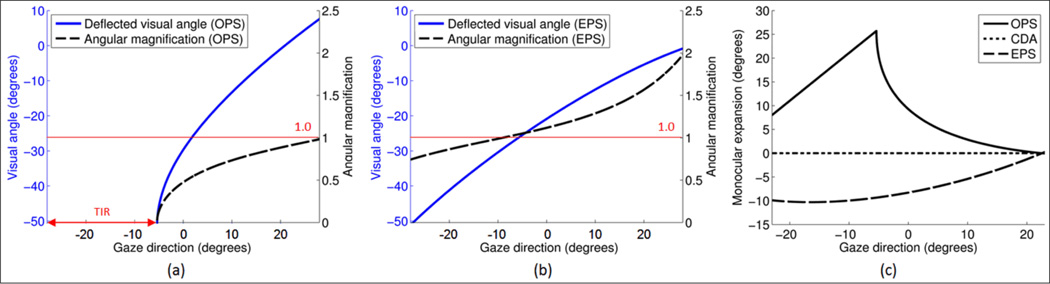
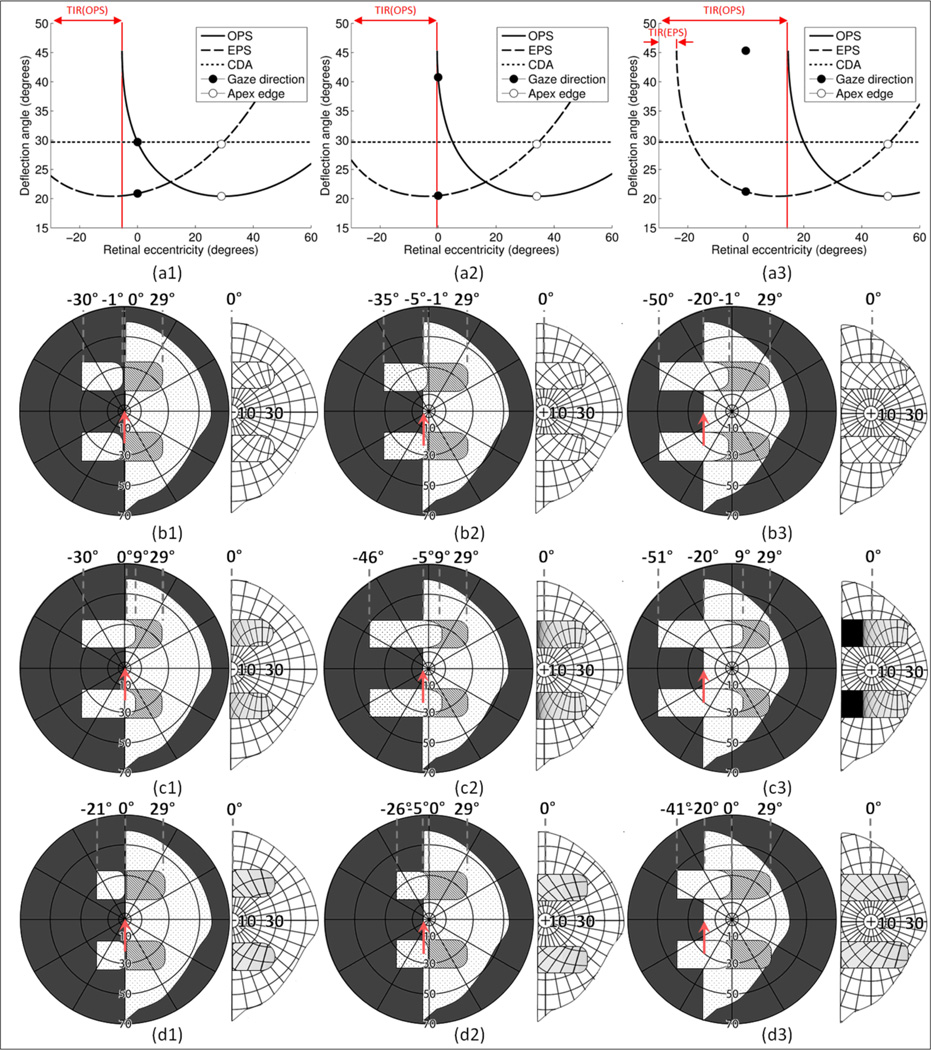
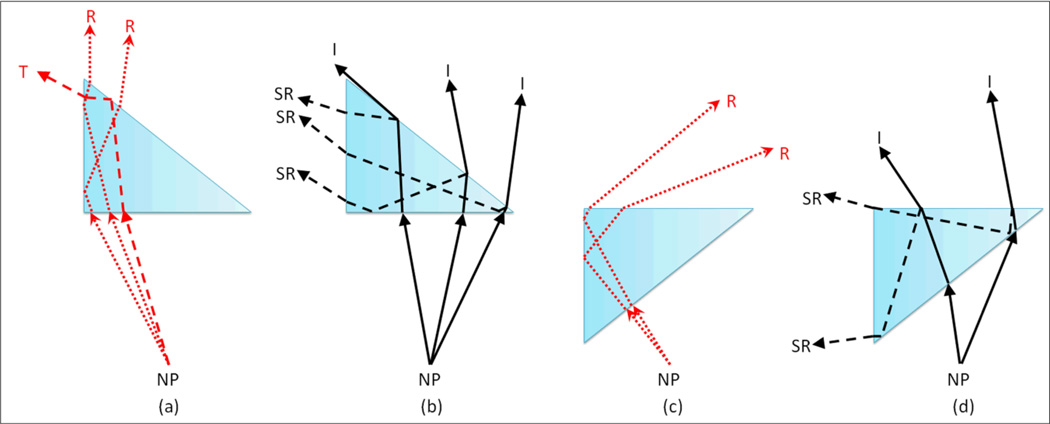
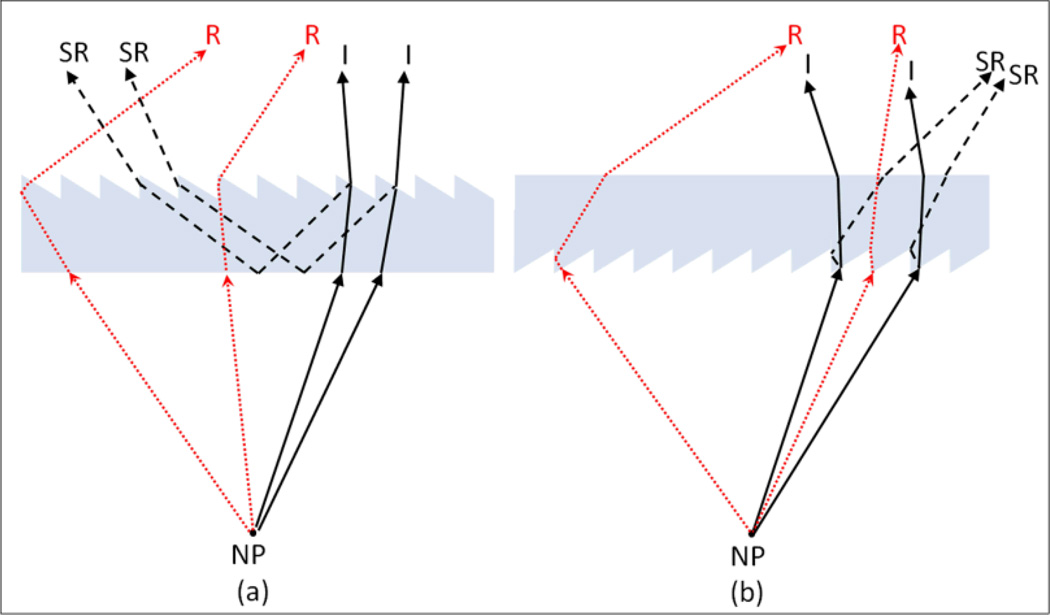
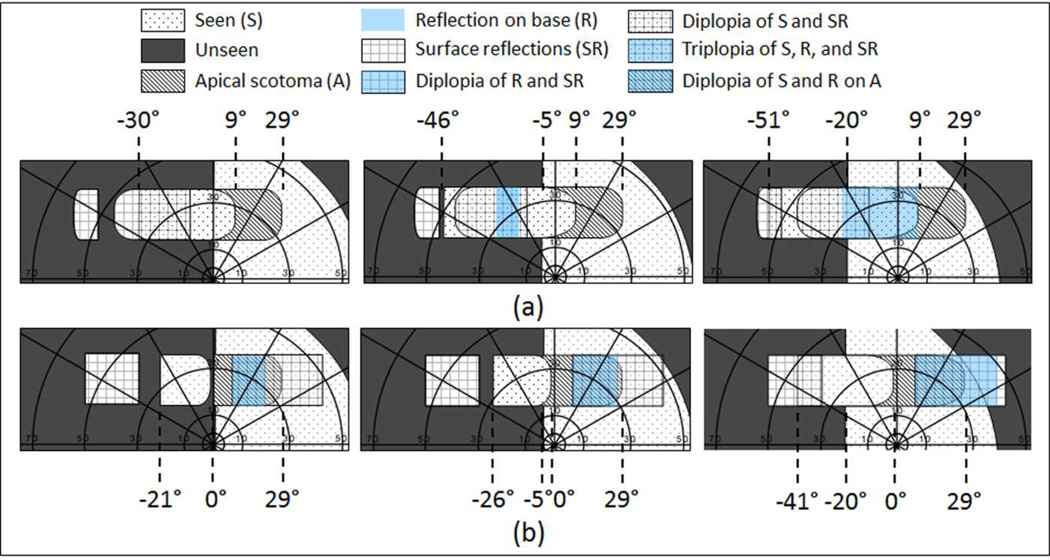
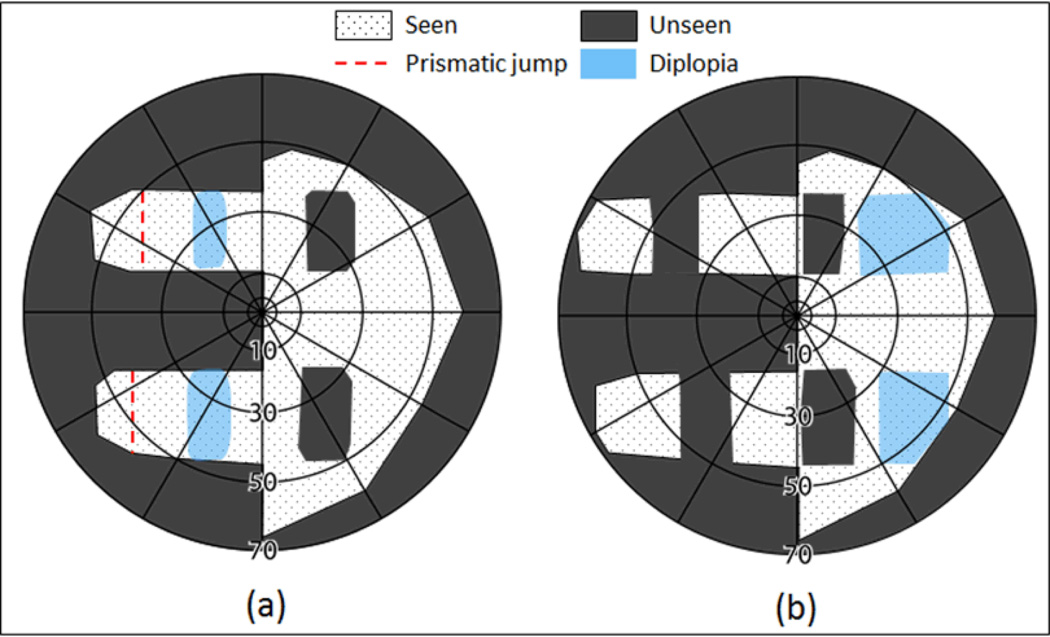
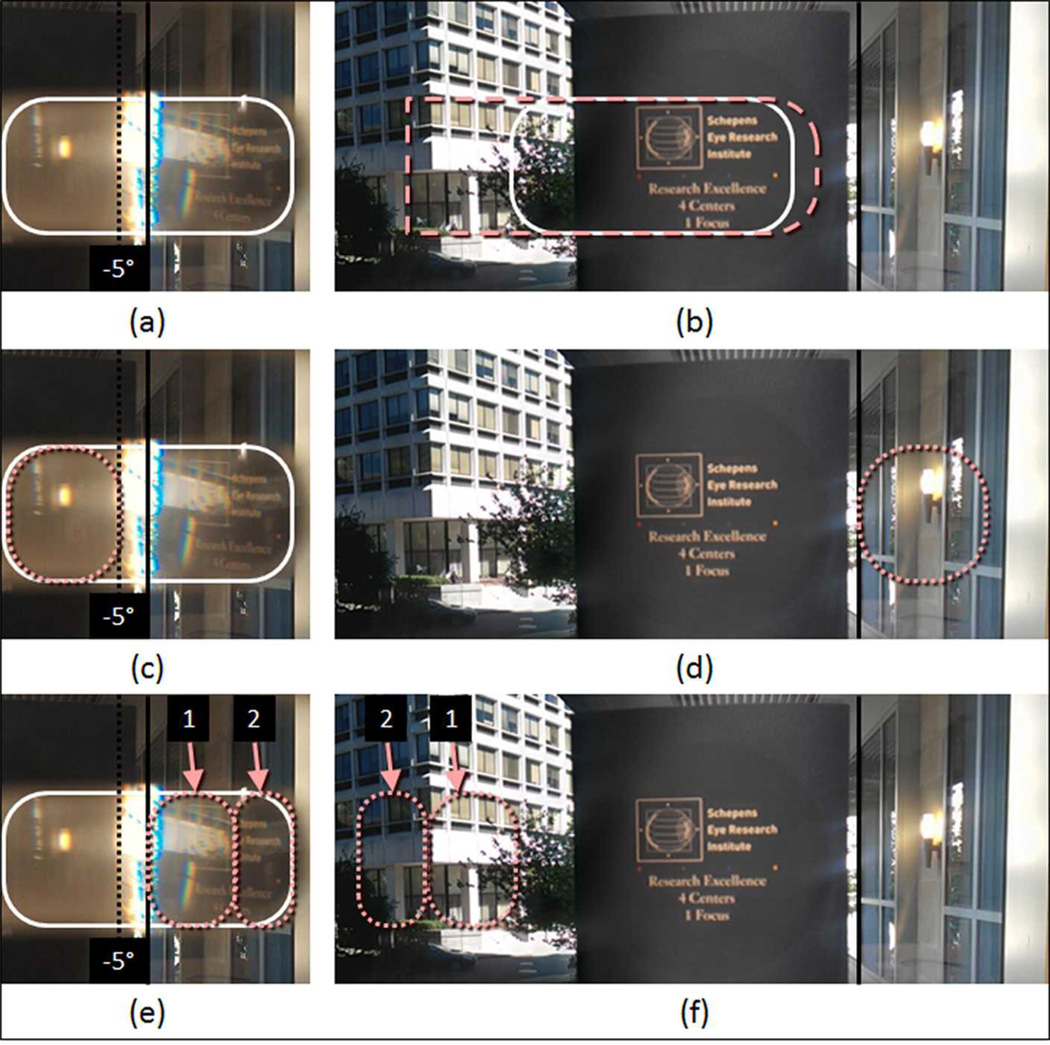
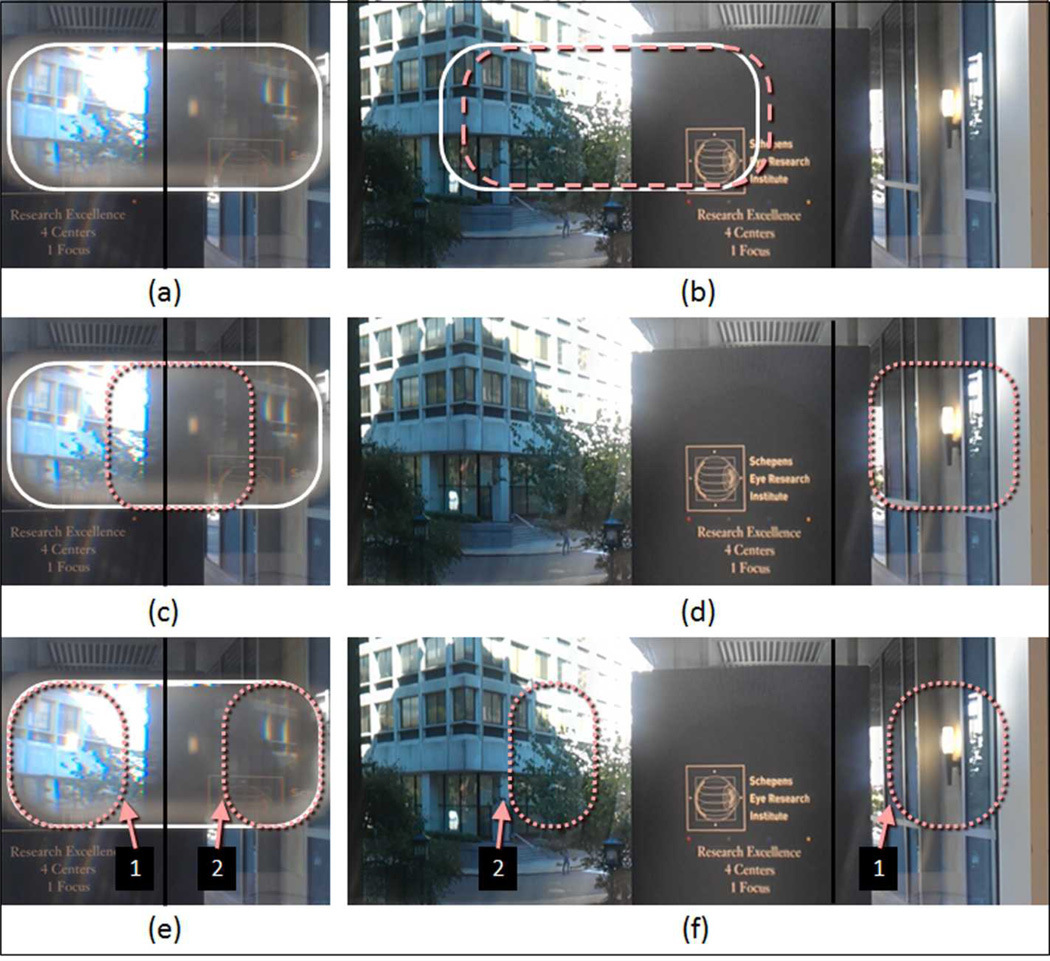
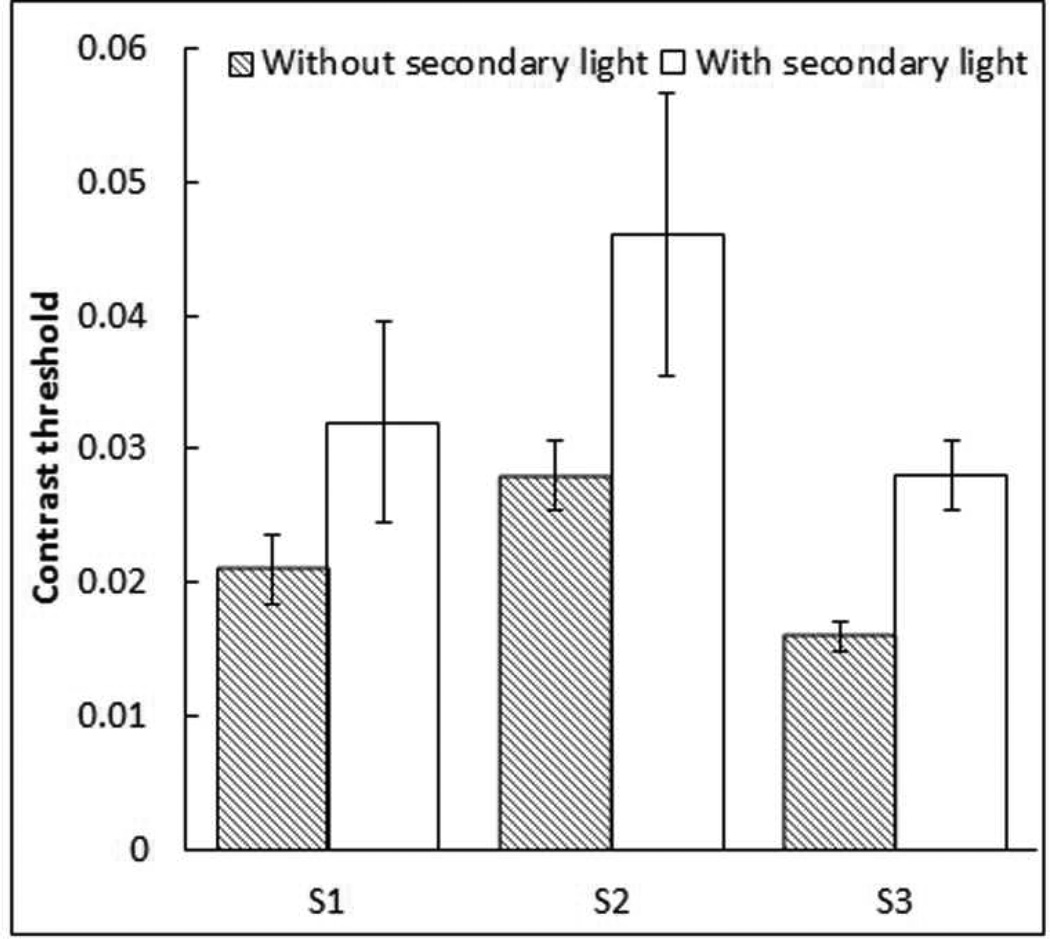
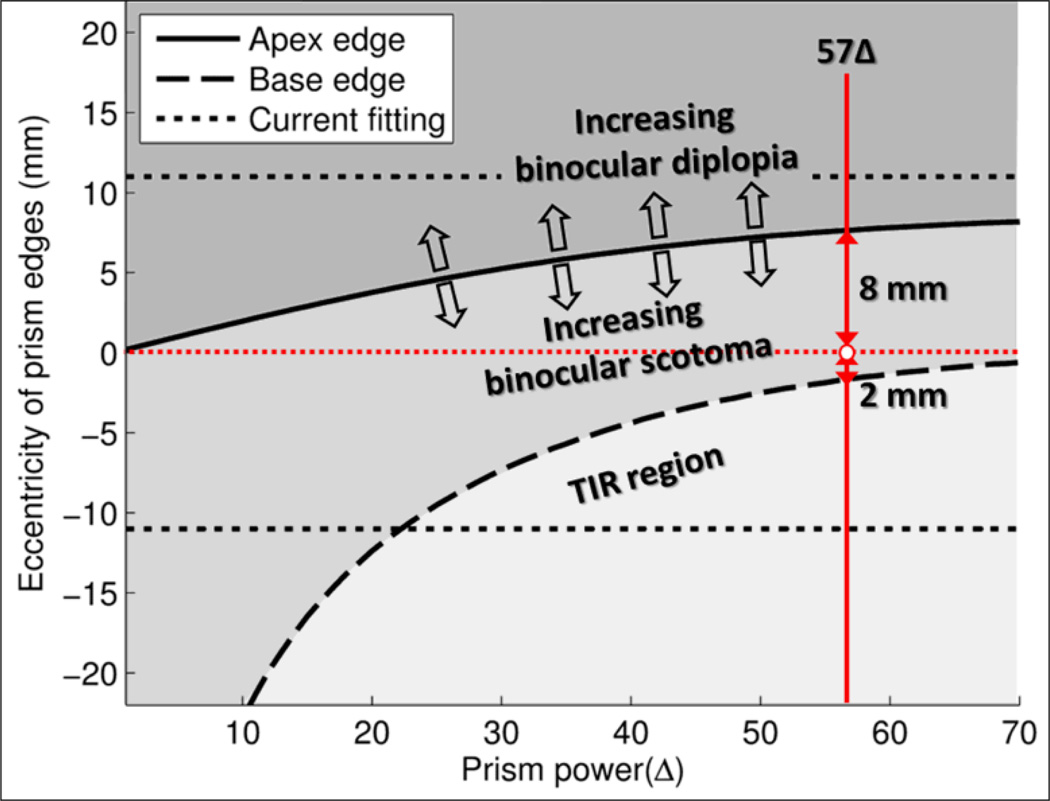
Prism distortions and spurious reflections are not usually considered when prescribing prisms to compensate for visual field loss due to homonymous hemianopia. Distortions and reflections in the high power Fresnel prisms used in peripheral prism placement can be considerable, and the simplifying assumption that prism deflection power is independent of angle of incidence into the prisms results in substantial errors. We analyze the effects of high prism power and incidence angle on the field expansion, size of the apical scotomas, and image compression/expansion. We analyze and illustrate the effects of reflections within the Fresnel prisms, primarily due to reflections at the bases, and secondarily due to surface reflections. The strength and location of these effects differs materially depending on whether the serrated prismatic surface is placed toward or away from the eye, and this affects the contribution of the reflections to visual confusion, diplopia, false alarms, and loss of contrast. We conclude with suggestions for controlling and mitigating these effects in clinical practice.

Keywords: hemianopia; low vision; peripheral prisms; prism distortions; prism treatment; spurious reflections; vision rehabilitation; visual field loss.


Figures

Figure 1
Figure 1
Distortions and reflections in a 57Δ base-left prism. A perimetry grid (concentric circles) was used to illustrate the prism distortion at primary gaze (PG). The upper half shows a calculated view of the grid, assuming a constant deflection angle (CDA) of 30° (57Δ). The lower half is a photograph taken through a Fresnel prism with its flat surface closest to the eye (camera) and with outward prism serrations (OPS). Thus the angle of incidence at the center of the prism PG is 0° and the prism deflects with its rated 30° power. Power falls with eccentricity to the right of PG, and the image at the apex (A) is shifted only by about 20°. To the left of PG, power increases and transmittance of the intended image decreases rapidly with eccentricity toward the base (B), reaching TIR at about 5° left (red arrow). Beyond that, the intended shifted grid view is missing and spurious reflections dimly show unrelated regions of the scene (grid lines and blue blur from a window). With this photo setup, the 22 mm prisms subtend about 50° of visual angle, not the usual 58° because of a difference in prism to nodal point distances of the camera and human eye.
Figure 2
Figure 2
Notations. NP is the nodal point of the eye. It is convenient to trace rays from NP out, rather than in the direction light travels. The angle sign convention is that clockwise rotation from the normal to the surface is positive, as illustrated in the circle. The prism apex angle is α. PG is the primary gaze direction (the head direction). β is the angle of rotation of the first refracting surface from the normal to PG. β = 0 for OPS and β = α for EPS. When we describe a shifted image viewed through the prism, gaze direction and retinal eccentricity have to be considered. Although the deflection at the gaze point is determined by the angle of incidence at the gaze point, the deflection angle (δ) at each other retinal eccentricity (θ´) depends on the angle of incidence at that eccentricity. The figure illustrates a gaze shifted left from PG to an arbitrary (and negative) gaze angle θG. The retinal eccentricity of the ray shown in red is θ´, while its angle from PG is θ (so θ = θ' - θG). φ is the resulting angle of incidence of the ray at the first refracting surface. φ = θ + β. An angle of incidence φ at the first refracting surface results in prism deflection angle δ relative to φ and visual angle V relative to PG. The deflection angle δA and visual angle VA at the apex edge are determined by the angle of incidence at the apex. As explained later, we measure gaze angles from NP, not the eye’s center of rotation.
Figure 3
Figure 3
Prism power (left axis) and light transmittance (right axis) as a function of angle of incidence calculated for 57Δ and 20Δ prisms. The higher power prism (57Δ) varies in deflection and transmittance substantially more than the lower power prism (20Δ). For an OPS prism, gaze angle (θG) and incidence angle at the gaze point are the same, so the deflection angle also represents the expansion angle at the gaze angle. With 57Δ the expansion saturates at the point of TIR beyond an incidence angle of −5.3°.
Figure 4
Figure 4
Categories of reflections in prisms. (a) TIRs. T: Primary rays that encounter TIR at the second surface due to angle of incidence < φc at the first refracting surface. R: Primary rays that encounter TIR at the prism base. (b) Surface reflection. I: Intended path of deflected primary rays. SR: Surface reflection component of transmitted primary rays. T, R, and SR are spurious reflections
Figure 5
Figure 5
Deflection power as a function of direction of gaze for 57Δ prisms. The curve for the EPS prism is shifted left with respect to OPS by the size of the apex angle (38.6°). At the primary position of gaze the power of OPS is same as the rated power (57Δ), but the power of EPS is only 38Δ. The EPS shift provides useful field expansion for gaze shifts farther into the blind hemifield than the OPS configuration, where the expansion is limited by TIR at −5.3°.
Figure 6
Figure 6
Apical scotoma angular size as a function of rated prism power for OPS and EPS configurations. EPS apical scotomas are slightly larger than the rated power for prisms up to 54Δ. Relative scotoma size falls off considerably with increasing power in OPS configurations, becoming 10° smaller than the 30° prediction of CDA at 57Δ.
Figure 7
Figure 7
Magnification and minification with 57Δ prisms. (a) OPS prism deflection visual angle (V) at the gaze point (θ’ = 0°) varies with gaze angle (θG). At each gaze direction, the variable deflection (left axis) manifests as a different amount of minification (right axis). (b) With EPS, TIR is not reached within the prism segment, and there is magnification at most gaze angles. (c) Monocular field expansion (exit visual field size minus prism entrance visual field) as a function of gaze angle. OPS provides true monocular field expansion at all gaze angles into the prism, while EPS magnifies, and loses monocular field area. Of course, with the angular shift, unilateral EPS provides binocular field expansion, but less than OPS. (Note that for OPS, at gaze angles below TIR, the deflection at TIR remains available in the seeing hemifield, so the deflection visual angle at the critical angle of incidence is given as the deflection visual angle at the gaze point.)
Figure 8
Figure 8
Simulated monocular Goldmann and percept diagrams for left HH to illustrate prism distortions and apical scotomas. Columns 1, 2, and 3 are for gazes at primary, −5°, and −20°, respectively. Row (a) identifies the variation of deflected visual angle (V) at each retinal eccentricity (θ´). Specifically, the retinal eccentricity to the apex (θ´A) and gaze (always θ´ = 0) point (for primary, −5°, and −20° gaze direction) are marked to show the eccentricity range. Rows (b), (c), and (d) are the Goldmann diagrams and the percept diagrams for CDA, OPS, and EPS configurations, respectively. Field in the apical scotomas, hatching, would be visible in the binocular view. Differences in apical scotoma size due to prismatic magnification and minification are evident, as are the compressive effects near TIR for OPS. Since deflection angle for EPS changes slowly around PG there is less distortion and less variation in transmittance than for OPS, as seen in the percept diagrams. However, the expanded visual field in each case for EPS is always smaller than for OPS. Only the seeing field is shown for the percept diagrams to save space.
Figure 9
Figure 9
Spurious reflections for OPS (a & b) and EPS (c & d). T: Primary rays that encounter TIR due to angle of incidence < φc. R: Primary rays that encounter TIR at the prism base. I: Intended path of deflected primary rays. SR: Surface reflection component resulting from reflections at either surface or both.
Figure 10
Figure 10
Meaningful reflections in Fresnel prisms. (a) For OPS, primary rays at negative incidence angles reflect via TIR from the bases, causing a strong spurious (and reversed) image (R). At incidence angles < φc this image appears in the dark region of TIR of the intended expanded image at the second refracting surface, making it highly visible. These reflections can readily cause monocular diplopia and false alarms when the wearer scans toward the blind hemifield. Relatively dim surface reflections (SR) at the second refracting surface from primary rays at higher negative incidence angles are reflected via TIR at the first refracting surface and exit through the bases. If they originate in a region much brighter than the intended image they can cause monocular visual confusion and reduced contrast. (b) For EPS, the bases can be encountered over the full range of gaze angles, either as a first refracting surface or via reflection. TIR reflections (R) at the bases can form bright spurious images with monocular visual confusion and diplopia. Surface reflections (SR) at the bases can form dim images, noticeable with monocular visual confusion and diplopia if they originate from a particularly bright region in the environment. I: Intended path of deflected primary rays
Figure 11
Figure 11
Simulated monocular Goldmann perimetry indicating field locations of sources of meaningful reflections in 57Δ Fresnel prisms for left HH. (a) OPS and (b) EPS. Goldmann diagrams indicate where in the observed scene the detected stimulus would be located, not where it falls in the subject’s visual field. Areas shaded (as calculated by ray tracing) to indicate monocular diplopia or triplopia identify stimulus regions where the subject would see more than one image of the same stimulus at the same time in different directions. Seen (S) indicates both the intended view through the prism and the non-prism view. To differentiate unseen and apical scotoma, we present the apical scotoma as (A). The left column diagrams PG, while the middle and left columns are for left gaze at −5° and −20°, respectively. Surface reflections (SR) are seen, but at considerably dimmer luminance, while reflections on the bases (R) are bright and seen with minimal luminance loss. In all cases, SR and R portions without monocular diplopia and triplopia cause monocular visual confusion, as they are seen in the seeing hemifield and are superimposed on the intended image. With OPS, the bright reflections R are primarily within the blind hemifield and cannot be seen at PG, but their visibility increases with gaze shifts to the left. With EPS, however, R also causes monocular visual confusion and diplopia within the seeing hemifield at PG and more positive gaze angles.
Figure 12
Figure 12
Measured monocular Goldmann perimetry for the left eye of a patient with left HH. The testing was not limited to the intended prism view area, as we looked for spurious reflections. (a) OPS. The reduced extent of the apical scotoma in OPS due to the lower power at the prism apex is evident. Monocular diplopia is reported from stimuli presented in the blind hemifield where the intended image and surface reflections overlapped. The dashed vertical line indicates where the subject reported stimulus flicker, indicating a transition between distinct reflection paths, in this case due to the transition from the end of the intended expansion to the spurious reflection that caused false expansion. In actual use, the area left of diplopia causes monocular visual confusion of the intended image and the surface reflection image. (b) EPS. The reduction in apical scotoma size in this case is due to surface reflections falling on that area, causing monocular visual confusion and diplopia within the seeing hemifield, as well as the false alarms from the extreme region at the left. The seeing part at the far left of the blind left hemifield is the surface reflection portion and it may cause monocular visual confusion in actual use.
Figure 13
Figure 13
Photographed view through 57Δ OPS base-left Fresnel prism. The solid vertical black line in each figure is at 0° (PG) incidence angle and the dashed vertical line in (a), (c), and (e) is at the critical angle of incidence (−5.3°). (a) The view through the OPS prism is outlined. (b) The same view without the prism. The solid outline indicates the area that would be viewed in a prism under the CDA, while the pink dashed outline indicates the area seen minified in the OPS prism in (a), illustrating the slightly smaller apical scotoma resulting from reduced power at the apex incidence and increased expansion range due to high power at the base. In (a) the white building is compressed into a blur in the intended view as TIR is approached left of prism center. (c) Reflection (R) caused by reflection on the bases is outlined (lamp and glare on the window). It is a slightly blurred mirror image of the region outlined in (d), and is seen in an area of TIR of the intended rays that only slightly reduces the contrast of the spurious reflection. Although it cannot be seen in PG with HH, it may cause monocular visual confusion and a false alarm when the gaze is shifted to the blind side. (e) Two dimmer areas of surface reflections (SR) are outlined and numbered (different parts of the building), and their corresponding sources are indicated in (f). They fall within the seeing hemifield, where they cause monocular visual confusion (between the building area marked 2 and part of the brochure) and some monocular diplopia (of the building portion from the area marked 1 seen from SR and the highly compressed intended view to the left of it). The camera view of the prisms subtended about ±23° resulting in a somewhat smaller effect of angle of incidence than the ±29° typically subtended by peripheral prisms. However, the prism angular shifts are the same as at the normal NP distance from the prisms.
Figure 14
Figure 14
Photographed view through a 57Δ EPS base-left Fresnel prism. The vertical line in each figure is at 0° (PG) incidence angle. (a) The view through an EPS prism is outlined. The entire view is less distorted than with OPS, but reflections affect both seeing and blind hemifields. (b) The same view without the prism. The solid outline indicates the area that would be viewed in a prism with CDA, while the dashed pink outline indicates the area seen directly in the EPS prism. Magnification results in a narrower field seen through the prism view than with CDA or the OPS shown in Fig. 13, but without the pronounced distortion and TIR light loss left of center that affects OPS. However, the entire view is compromised by bright reflections. (c) Reflections on the bases (R) superimpose a strong mirror image of the bright area (lamp and glare on the window) to the right in (d) and cause monocular visual confusion. (e) Dimmer surface reflections (SR) from the area marked 2 (shaded part of building) outlined in (f) superimposes an almost see-through view in the primary seeing hemifield, causing monocular visual confusion (seeing the part of the brochure and bright building at the same direction) and reduced contrast for the intended brochure view. But, the surface reflection from the area marked 1 (area around the lamp) will fall on the blind hemifield. When the patient scans leftward, the area marked 1 (including the lamp) causes monocular visual confusion with the bright building from the intended image, and the area marked 2 causes diplopia (shaded part of the building seen twice; once dim in SR and once bright in the intended image on the blind side).
Figure 15
Figure 15
Contrast detection thresholds with and without surface reflections from a bright light for 3 normally sighted subjects viewing through a 57Δ OPS Fresnel prism. Error bars indicate the bootstrapped 95% confidence interval.(26) Contrast thresholds of each subject were increased (reduced contrast sensitivity) by the base surface reflections of the stand light.
Figure 16
Figure 16
Optimizing OPS prism placement for PG. The prisms should not extend into the region of TIR, as that only provides spurious reflections without field expansion. The visual angle to the prism apex should equal the angular size of the apical scotoma. Extending farther into the seeing side includes field in the prism that is also seen by the fellow non-prism eye (diplopia), while the apical scotoma of a narrower prism would extend into the blind hemifield, without compensation by the fellow eye (binocular scotoma - reduced field expansion). The dotted lines indicate the current placement of 22 mm prisms centered at PG. A 10 mm wide 57Δ prism with base 2 mm left of PG is optimal.

References

    1. Apfelbaum HL, Ross NC, Bowers AB, Peli E. Considering optical scotomas, confusion, and diplopia when prescribing prisms for homonymous hemianopia. Translational Vision Science & Technology. 2013;2(4) - PMC - PubMed
    1. Zhang X, Kedar S, Lynn MJ, Newman NJ, Biousse V. Natural history of homonymous hemianopia. Neurology. 2006;66(6):901–905. - PubMed
    1. Rossi PW, Kheyfets S, Reding MJ. Fresnel prisms improve visual perception in stroke patients with homonymous hemianopia or unilateral visual neglect. Neurology. 1990;40(10):1597–1599. - PubMed
    1. Bowers AR, Mandel AJ, Goldstein RB, Peli E. Driving with hemianopia: 1. Detection performance in a driving simulator. Investigative Ophthalmology & Visual Science. 2009;50(11):5137–5147. - PMC - PubMed
    1. Bronstad PM, Bowers AR, Albu A, Goldstein RG, Peli E. Hazard detection by drivers with paracentral homonymous field loss: A small case series. Journal of Clinical & Experimental Ophthalmology. 2011;2011(S5) - PMC - PubMed