. 2014 Jan 30;10(1):e1003902.
doi: 10.1371/journal.ppat.1003902. eCollection 2014 Jan.

Reengineering redox sensitive GFP to measure mycothiol redox potential of Mycobacterium tuberculosis during infection

Affiliations

Reengineering redox sensitive GFP to measure mycothiol redox potential of Mycobacterium tuberculosis during infection

Ashima Bhaskar et al. PLoS Pathog. .

Abstract

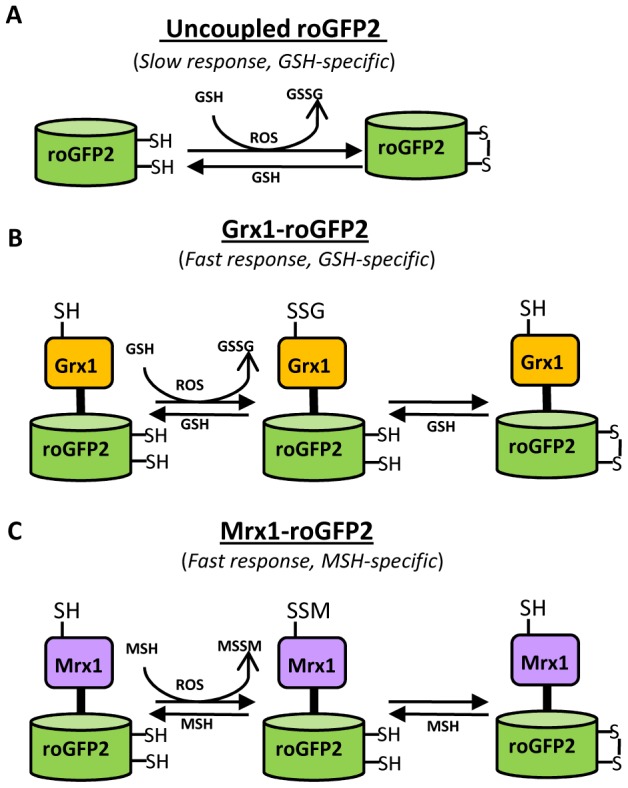
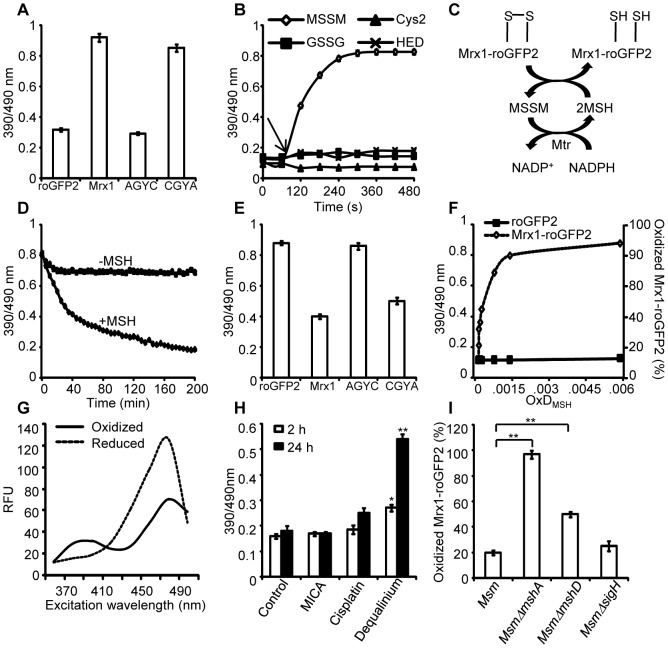
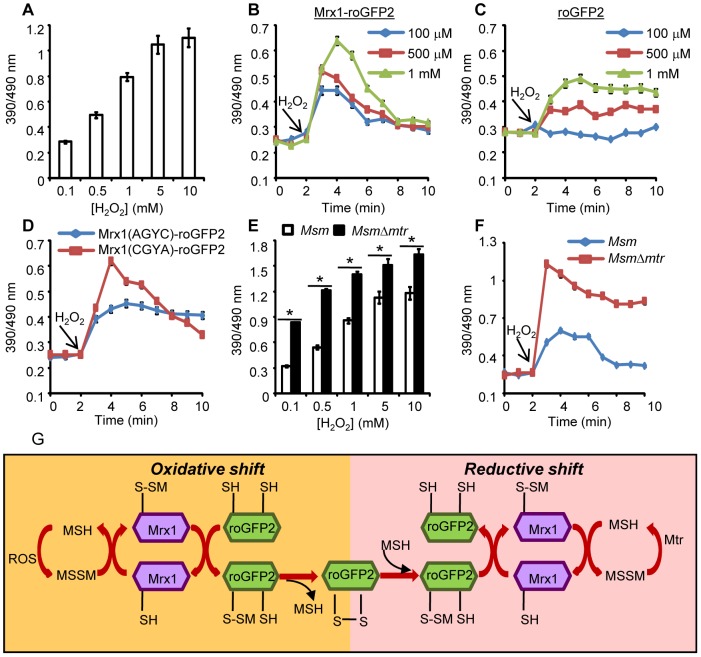
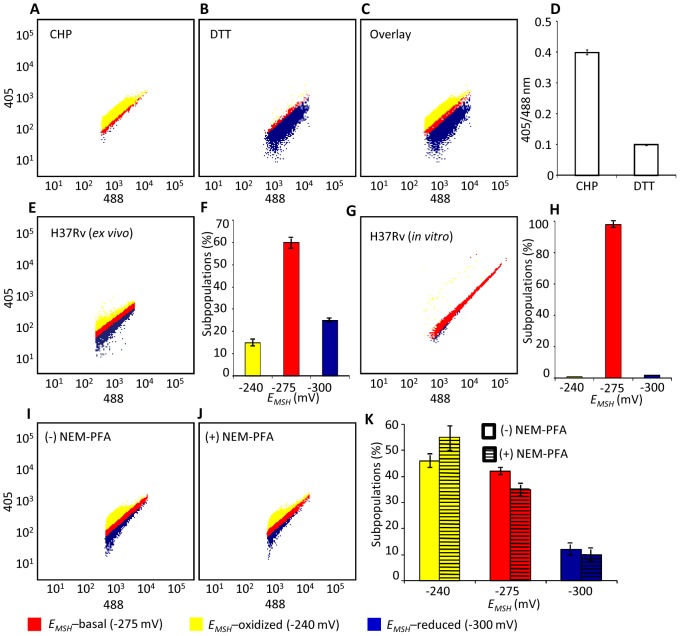
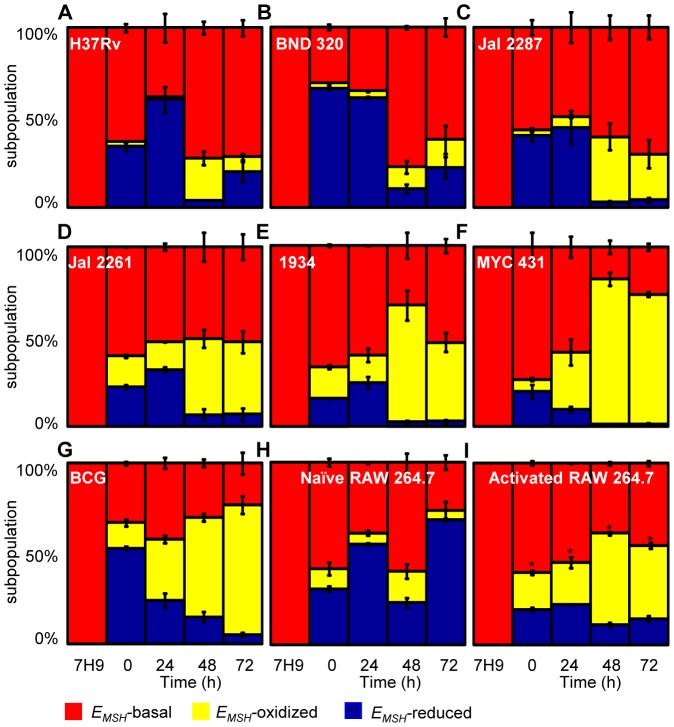
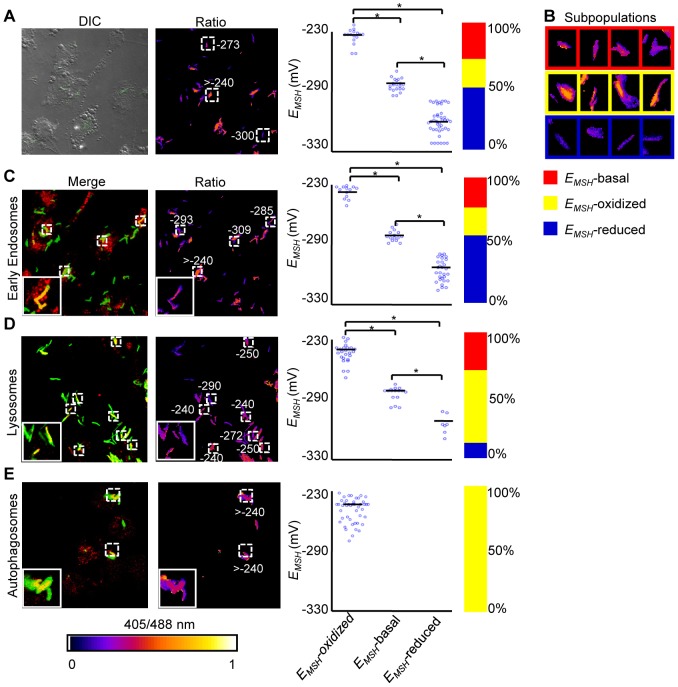
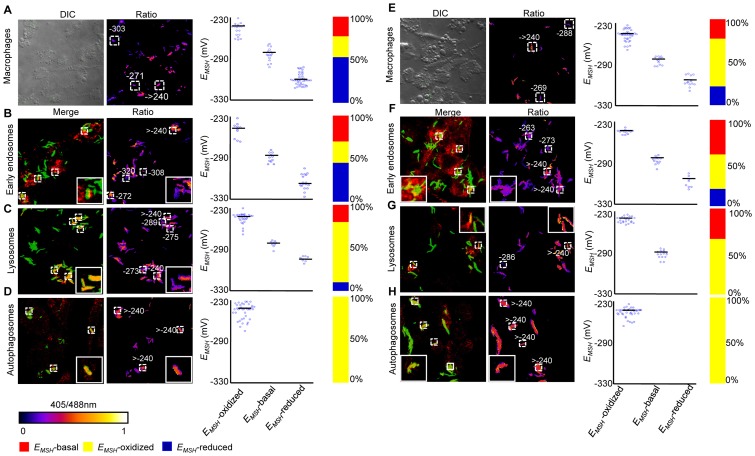
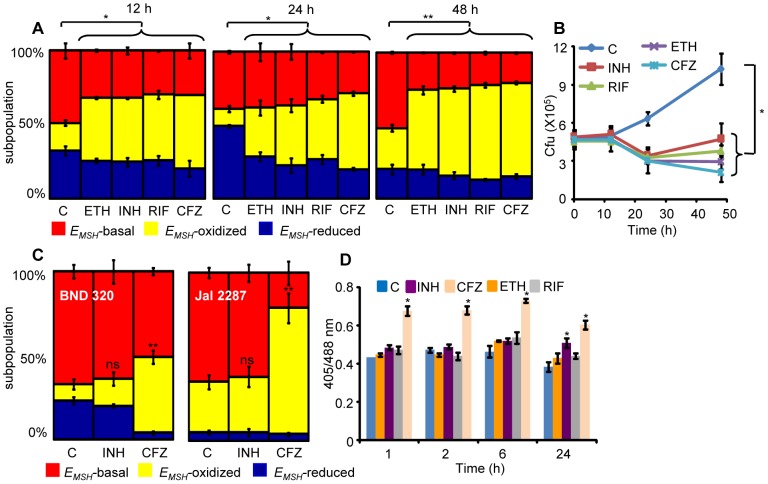
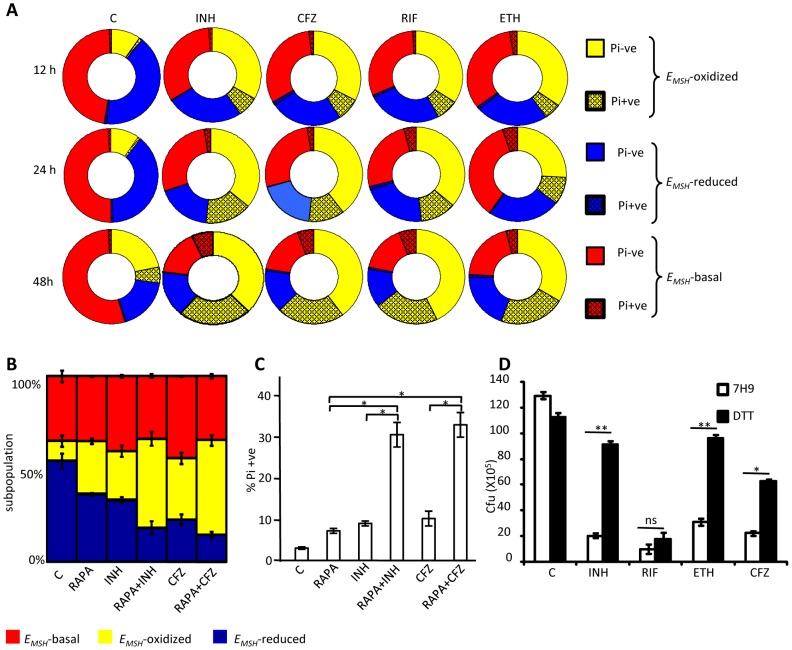
Mycobacterium tuberculosis (Mtb) survives under oxidatively hostile environments encountered inside host phagocytes. To protect itself from oxidative stress, Mtb produces millimolar concentrations of mycothiol (MSH), which functions as a major cytoplasmic redox buffer. Here, we introduce a novel system for real-time imaging of mycothiol redox potential (EMSH ) within Mtb cells during infection. We demonstrate that coupling of Mtb MSH-dependent oxidoreductase (mycoredoxin-1; Mrx1) to redox-sensitive GFP (roGFP2; Mrx1-roGFP2) allowed measurement of dynamic changes in intramycobacterial EMSH with unprecedented sensitivity and specificity. Using Mrx1-roGFP2, we report the first quantitative measurements of EMSH in diverse mycobacterial species, genetic mutants, and drug-resistant patient isolates. These cellular studies reveal, for the first time, that the environment inside macrophages and sub-vacuolar compartments induces heterogeneity in EMSH of the Mtb population. Further application of this new biosensor demonstrates that treatment of Mtb infected macrophage with anti-tuberculosis (TB) drugs induces oxidative shift in EMSH , suggesting that the intramacrophage milieu and antibiotics cooperatively disrupt the MSH homeostasis to exert efficient Mtb killing. Lastly, we analyze the membrane integrity of Mtb cells with varied EMSH during infection and show that subpopulation with higher EMSH are susceptible to clinically relevant antibiotics, whereas lower EMSH promotes antibiotic tolerance. Together, these data suggest the importance of MSH redox signaling in modulating mycobacterial survival following treatment with anti-TB drugs. We anticipate that Mrx1-roGFP2 will be a major contributor to our understanding of redox biology of Mtb and will lead to novel strategies to target redox metabolism for controlling Mtb persistence.


Conflict of interest statement

The authors have declared that no competing interests exist.

Figures

Figure 1
Figure 1. Diagram illustrating the principle of roGFP2 based sensors.
(A) roGFP2 contains two Cys residues capable of forming an intramolecular disulfide bond in response to changes in intracellular EGSH. The redox equilibrium of roGFP2 with the GSH/GSSG couple occurs through endogenous glutaredoxins and proceeds slowly. (B) Fusion of human Grx1 in Grx1-roGFP2 substantially improved specificity and rate of thiol-disulfide exchange between roGFP2 dithiol and 2GSH/GSSG couple. (C) Replacing Grx1 with Mrx1 in Mrx1-roGFP2 ensured continuous equilibration between roGFP2 and 2MSH/MSSM pair.
Figure 2
Figure 2. Mrx1 catalyzes specific equilibration between mycothiol redox system and roGFP2 in vitro and in vivo.
(A) Pre-reduced roGFP2 (lane 1), Mrx1-roGFP2 (lane 2), Mrx1(AGYC)-roGFP2 (lane 3), and Mrx1(CGYA)-roGFP2 (lane 4) were exposed to 50 µM of MSSM for 10 min and ratiometric sensor response was measured. (B) Pre-reduced Mrx1-roGFP2 was treated with 1 µM of MSSM, GSSG, cystine (Cys2) or 2-hydroxyethyl disulfide (HED) and ratiometric sensor response was measured at various time points. (C) Molecular mechanism showing the reduction of oxidized Mrx1-roGFP2 by MSH/Mtr/NADPH pathway. (D) Oxidized Mrx1-roGFP2 was added as a substrate to the MSH/Mtr/NADPH redox pathway and ratiometric sensor response was measured over time. A control reaction in the absence of MSH was performed in parallel. (E) Reduction of oxidized roGFP2 (lane 1), Mrx1-roGFP2 (lane 2), Mrx1(AGYC)-roGFP2 (lane 3), and Mrx1(CGYA)-roGFP2 (lane 4) by MSH/Mtr/NADPH redox pathway. Maximum ratio change after 150 min of incubation with MSH/Mtr/NADPH reaction mixture is shown. (F) Mrx1-roGFP2 is extremely sensitive towards small changes in OxDMSH. Reduced uncoupled roGFP2 and Mrx1-roGFP2 proteins were incubated with mycothiol solutions (1 mM total) containing increasing fractions of MSSM for a maximum of 30 sec and ratiometric sensor response was measured. Note that the response of Mrx1-roGFP2 becomes exceedingly linear in the window between 10% to 90% oxidation, suggesting that the biosensor can effectively measure changes in EMSH within this range of probe oxidation. (G) Excitation spectra of Msm expressing Mrx1-roGFP2 upon treatment with 0.4 mM of diamide (oxidant) or 10 mM of DTT (reductant) for 5 min. (H) Msm expressing Mrx1-roGFP2 was either left untreated (control) or exposed to 50 µM dequalinium, cisplatin and 5-methoxyindole-2-carboxylic acid (MICA) and ratiometric sensor response was measured after 2 h and 24 h post-exposure. p-values shown in the panel were calculated by comparing untreated group and dequalinium treated group. (I) Percentage of OxDMrx1-roGFP2 in exponentially grown Msm, MsmΔmshA, MsmΔmshD, and MsmΔsigH was calculated (see Materials and Methods for mathematical definition). Note that biosensor is completely oxidized (∼95%) in the absence of MSH reducing system in MsmΔmshA. p-values shown in the panel were calculated by independently comparing MsmΔmshA and MsmΔmshD groups with the Msm group. Error bars represent standard deviations from the mean. * p<0.01, ** p<0.001. Data shown is the representative of at least three independent experiments.
Figure 3
Figure 3. Coupling of Mrx1 with roGFP2 facilitates detection of transient redox changes in mycobacteria.
(A) Msm expressing Mrx1-roGFP2 was treated with varying concentrations of H2O2 for 2 min and ratiometric sensor response was measured. Msm expressing (B) Mrx1-roGFP2 or (C) roGFP2 was treated with the indicated amounts of H2O2 and the ratiometric sensor response was measured. (D) Oxidation of Msm expressing Mrx1(AGYC)-roGFP2 and Mrx1(CGYA)-roGFP2 exposed to 1 mM H2O2. (E) Msm and MsmΔmtr strains expressing Mrx1-roGFP2 were oxidized with indicated concentrations of H2O2 and the ratiometric sensor response was measured. (F) Msm and MsmΔmtr strains expressing Mrx1-roGFP2 were exposed to 1 mM H2O2 and ratiometric sensor response was measured as a function of time. Error bars represent standard deviations from the mean. * p<0.01. Data are representative of at least three independent experiments. (G) Proposed molecular mechanism of the Mrx1-roGFP2 biosensor. In response to oxidative stress, the nucleophillic cysteine (C14) of Mrx1 specifically reacts with MSSM to generate a mixed Mrx1-MSSM intermediate. The Mrx1-MSSM interacts with one of the two proximal Cys thiols on roGFP2 and converts it into S-mycothionylated roGFP2. The generation of S-mycothionylated roGFP2 intermediate is subject to future experimentation. In the final step, S-mycothionylated roGFP2 rearranges to form intermolecular disulfide bond between Cys147-Cys204. This results in an oxidative shift in EMSH. Once oxidative stress depletes, EMSH normalizes predominantly via reduction of MSSM to MSH by Mtr.
Figure 4
Figure 4. Emergence of redox heterogeneity within Mtb population inside macrophages.
PMA-differentiated THP-1 cells were infected with Mtb H37Rv expressing Mrx1-roGFP2 (moi: 10) and ∼30,000 cells were analyzed by flow cytometry by exciting at 405 and 488 nm lasers at a constant emission (510 nm). The program BD FACS suite software was used to analyze the population distribution of Mtb, and each population was represented by an unique color. Using automatic and manual gating options, a strategy was adopted to categorize Mtb population into three subpopulations: EMSH-oxidized, EMSH-reduced and EMSH-basal. Number of events per subpopulation was counted and representative percentage of each subpopulation was estimated. Gates were selected on the basis of complete oxidation by 1 mM CHP (EMSH-oxidized) and complete reduction by 10 mM DTT (EMSH-reduced). Dot plots show shift in population towards oxidizing or reducing after treatment with (A) CHP and (B) DTT, respectively. (C) Overlay spectra of dot plots derived from CHP and DTT treatment of infected THP-1 cells. (D) Bar graph represents the ratiometric sensor response. (E) Dot plot of THP-1 cells infected with H37Rv expressing Mrx1-roGFP2 at 72 h p.i. (F) Bar graph represents percentage of bacilli in each subpopulation. (G) Dot plot of H37Rv expressing Mrx1-roGFP2 grown in 7H9 medium. (H) Bar graph represents percentage of bacilli in each subpopulation. (I) THP-1 cells were infected with BCG expressing Mrx1-roGFP2 and ∼30,000 cells were analyzed by flow cytometry at 24 h p.i. (J) In a parallel set, BCG infected cells were first fixed by NEM and PFA followed by flow cytometry. (K) Shown is the dot plot of BCG infected THP-1 cells with and without NEM-PFA treatment. Note that redox heterogeneity was preserved independent of NEM-PFA treatment. Bar graph represents percentage of bacilli in each subpopulation. The EMSH of mycobacterial cells in vitro and inside macrophages was calculated by fitting Mrx1-roGFP2 ratios into the in vitro redox calibration curve (see SI Materials and Methods ). Color codes representing each subpopulation with a defined average EMSH in the panels are shown at the bottom of the figure. Error bars represent standard deviations from the mean of at least three independent experiments.
Figure 5
Figure 5. Dynamic changes in intrabacterial EMSH during infection.
THP-1 cells were infected with Mrx1-roGFP2 expressing Mtb strains; (A) H37Rv, (B) BND 320, (C) Jal 2287, (D) 1934, (E) Jal 2261 (F) MYC 431 and (G) BCG at an moi of 10. (H) Naïve and (I) IFN-γ/LPS treated (activated) RAW 264.7 macrophages were infected with H37Rv (moi: 10). At indicated time points, cells were treated with NEM-PFA and ∼30,000 infected macrophages were analyzed by flow cytometry and intramycobacterial EMSH was measured as described in figure 4. The “0” h time point refers to time immediately after initial infection with H37Rv for 4 h. The percentage of bacilli in each subpopulation was calculated and plotted as a bar graph. Data shown is the result of at least six independent experiments performed in quadruplicate and data from biologically independent experiments were combined and represented as percentage of bacilli in each subpopulation ± standard deviation. p-values shown in the panel I were calculated by comparing EMSH-oxidized populations of resting and activated macrophages (* p<0.01).
Figure 6
Figure 6. Sub-vacuolar compartments are the source of redox heterogeneity within Mtb population during infection.
THP-1 cells were infected with H37Rv expressing Mrx1-roGFP2 (moi: 10). At 24 h p.i. infected cells were treated by NEM-PFA. Cells were then stained for EEA1 and LC3 and analyzed by confocal microscopy for measuring ratiometric sensor response in Mtb co-localized within early endosomes and autophagosomes, respectively. In case of lysosomes, the cells were first pre-treated with Lysotracker followed by NEM-PFA fixation. (A) False color ratio confocal image of Mtb (∼80) inside THP-1 at 24 h p.i. EMSH of bacilli was measured using in vitro calibration curve (SI Figure S5A). (B) Representative bacilli for each subpopulation are shown. Co-localization of Mtb H37Rv in (C) endosomes, (D) lysosomes, and (E) autophagosomes. The co-localization is demonstrated in the merged images, where green indicates bacteria, red indicates phagosomal markers, and yellow indicates a positive correlation. False color ratio images were generated as described in SI Materials and Methods . Small dashed line boxes indicate co-localized bacilli and large solid line boxes represent the enlarged view of the one of the co-localized bacilli. Numbers represent EMSH in millivolts. EMSH of co-localized bacilli (≥50) is calculated and distribution is shown in scatter plot. In each panel, scatter plot depicts quantification of microscopy data. Each point on the plot represents a bacterium. Bar represents mean values. p-values were calculated by one way ANOVA followed by Tukey's HSD statistical test (* p<0.01). Percentage of bacilli in each subpopulation is represented as a stacked bar graph in every panel. Color bar corresponds to the 405/488 nm ratios ranging from 0 to 1. Data shown is the representative of at least three independent experiments.
Figure 7
Figure 7. Redox heterogeneity in drug-resistant patient isolates during infection.
Infection of THP-1 macrophages, confocal microscopy, and EMSH measurements were performed as described for Figure 6. False color ratio confocal image of Jal 2287 (A) and MYC 431 (E) inside THP-1 at 24 h p.i. Small dashed line boxes indicate bacilli with varying EMSH. Co-localization of Mtb in (B and F) endosomes, (C and G) lysosomes, and (D and H) autophagosomes. False color ratio images were generated as described in SI Materials and Methods . Small dashed line boxes indicate co-localized bacilli and large solid line boxes represent the enlarged view of one of the co-localized bacilli. Relative distribution of Mtb subpopulations with varying EMSH is depicted as scattered plots and stacked bar graphs. Each point on the plot represents a bacterium. Approximately, ≥80 individual bacilli within macrophages and ≥50 individual bacilli within each compartment were imaged to calculate EMSH. Color bar corresponds to the 405/488 nm ratios ranging from 0 to 1. Data shown is representative of at least three independent experiments.
Figure 8
Figure 8. Anti-TB drugs induce oxidative shift in EMSH of Mtb during infection.
THP-1 cells infected with Mtb H37Rv expressing Mrx1-roGFP2 were treated with ETH (5 µg/ml), INH (0.5 µg/ml), RIF (0.5 µg/ml) and CFZ (0.5 µg/ml) immediately after infection. (A) At indicated time points redox heterogeneity within Mtb cells was analyzed by flow cytometry. (B) In a parallel experiment, infected macrophages were lysed and released bacilli were counted by plating for CFU. (C) THP-1 cells infected with the clinical strains BND 320 (INH mono-resistant) and Jal 2287 (MDR) were exposed to INH (0.5 µg/ml) and CFZ (0.5 µg/ml) immediately after infection and redox heterogeneity within Mtb cells 48 h p.i. was analyzed by flow cytometry. p-value shown in each panel was calculated by comparing untreated (control) and anti-TB drugs treated groups. (D) Mtb H37Rv expressing Mrx1-roGFP2 grown till exponential phase in 7H9-ADS medium was independently treated with ETH (5 µg/ml), INH (0.5 µg/ml), RIF (0.5 µg/ml) and CFZ (0.5 µg/ml) and ratiometric sensor response was measured at indicated time points. C: represents untreated control at each time point. Error bars represent standard deviations from the mean. * p<0.01, **p<0.001, ns: not significant. Data are representative of at least three independent experiments.
Figure 9
Figure 9. Heterogeneity in intrabacterial EMSH modulates drug tolerance.
(A) THP-1 cells infected with Mtb H37Rv were treated with INH (0.5 µg/ml), CFZ (0.5 µg/ml), RIF (0.5 µg/ml) and ETH (5 µg/ml). At indicated time points, intracellular bacteria were fixed with NEM, released from macrophages, and stained with Pi. Pi status and EMSH of bacterial cells were determined using multi-parameter flow cytometric analysis. Pie charts display the percentage of Pi+ve and Pi-ve cells in each subpopulation. (B) THP-1 cells infected with Mtb H37Rv were treated with INH (0.5 µg/ml), CFZ (0.5 µg/ml), with or without rapamycin (200 nM) immediately after infection. At 24 h p.i. redox heterogeneity within Mtb cells was analyzed by flow cytometry. (C) In a parallel experiment, infected macrophages were lysed and released bacilli were stained with Pi. (D) Exponentially grown culture of Mtb H37Rv was treated with INH (0.5 µg/ml), CFZ (0.5 µg/ml), RIF (0.5 µg/ml) and ETH (5 µg/ml) in the presence or absence of 5 mM DTT (added at 0 and 2nd day, post-antibiotic treatment) and number of bacilli were counted by plating for CFU. Error bars represent standard deviations from the mean. C: represents untreated control in each panel. Error bars represent standard deviations from the mean. * p<0.05, ** p<0.001, ns: not significant. Data are representative of at least three independent experiments.

References

    1. Dye C, Williams BG (2010) The population dynamics and control of tuberculosis. Science 328: 856–861. - PubMed
    1. Ehrt S, Schnappinger D (2009) Mycobacterial survival strategies in the phagosome: defence against host stresses. Cell Microbiol 11: 1170–1178. - PMC - PubMed
    1. MacMicking JD, North RJ, LaCourse R, Mudgett JS, Shah SK, et al. (1997) Identification of nitric oxide synthase as a protective locus against tuberculosis. Proc Natl Acad Sci U S A 94: 5243–5248. - PMC - PubMed
    1. Cooper AM, Segal BH, Frank AA, Holland SM, Orme IM (2000) Transient loss of resistance to pulmonary tuberculosis in p47(phox−/−) mice. Infect Immun 68: 1231–1234. - PMC - PubMed
    1. Lee PP, Chan KW, Jiang L, Chen T, Li C, et al. (2008) Susceptibility to mycobacterial infections in children with X-linked chronic granulomatous disease: a review of 17 patients living in a region endemic for tuberculosis. Pediatr Infect Dis J 27: 224–230. - PubMed

Publication types

MeSH terms