

Comprehensive functional annotation of 77 prostate cancer risk loci
- PMID: 24497837
- PMCID: PMC3907334
- DOI: 10.1371/journal.pgen.1004102
Comprehensive functional annotation of 77 prostate cancer risk loci
Abstract
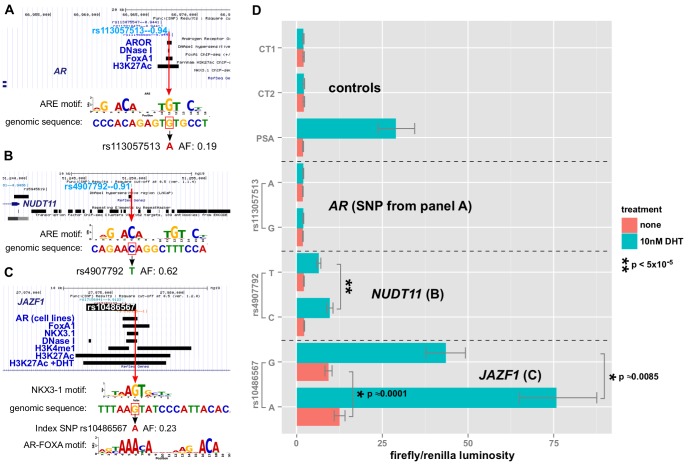
Genome-wide association studies (GWAS) have revolutionized the field of cancer genetics, but the causal links between increased genetic risk and onset/progression of disease processes remain to be identified. Here we report the first step in such an endeavor for prostate cancer. We provide a comprehensive annotation of the 77 known risk loci, based upon highly correlated variants in biologically relevant chromatin annotations--we identified 727 such potentially functional SNPs. We also provide a detailed account of possible protein disruption, microRNA target sequence disruption and regulatory response element disruption of all correlated SNPs at r(2) ≥ 0.88%. 88% of the 727 SNPs fall within putative enhancers, and many alter critical residues in the response elements of transcription factors known to be involved in prostate biology. We define as risk enhancers those regions with enhancer chromatin biofeatures in prostate-derived cell lines with prostate-cancer correlated SNPs. To aid the identification of these enhancers, we performed genomewide ChIP-seq for H3K27-acetylation, a mark of actively engaged enhancers, as well as the transcription factor TCF7L2. We analyzed in depth three variants in risk enhancers, two of which show significantly altered androgen sensitivity in LNCaP cells. This includes rs4907792, that is in linkage disequilibrium (r(2) = 0.91) with an eQTL for NUDT11 (on the X chromosome) in prostate tissue, and rs10486567, the index SNP in intron 3 of the JAZF1 gene on chromosome 7. Rs4907792 is within a critical residue of a strong consensus androgen response element that is interrupted in the protective allele, resulting in a 56% decrease in its androgen sensitivity, whereas rs10486567 affects both NKX3-1 and FOXA-AR motifs where the risk allele results in a 39% increase in basal activity and a 28% fold-increase in androgen stimulated enhancer activity. Identification of such enhancer variants and their potential target genes represents a preliminary step in connecting risk to disease process.
Conflict of interest statement
The authors have declared that no competing interests exist.
Figures
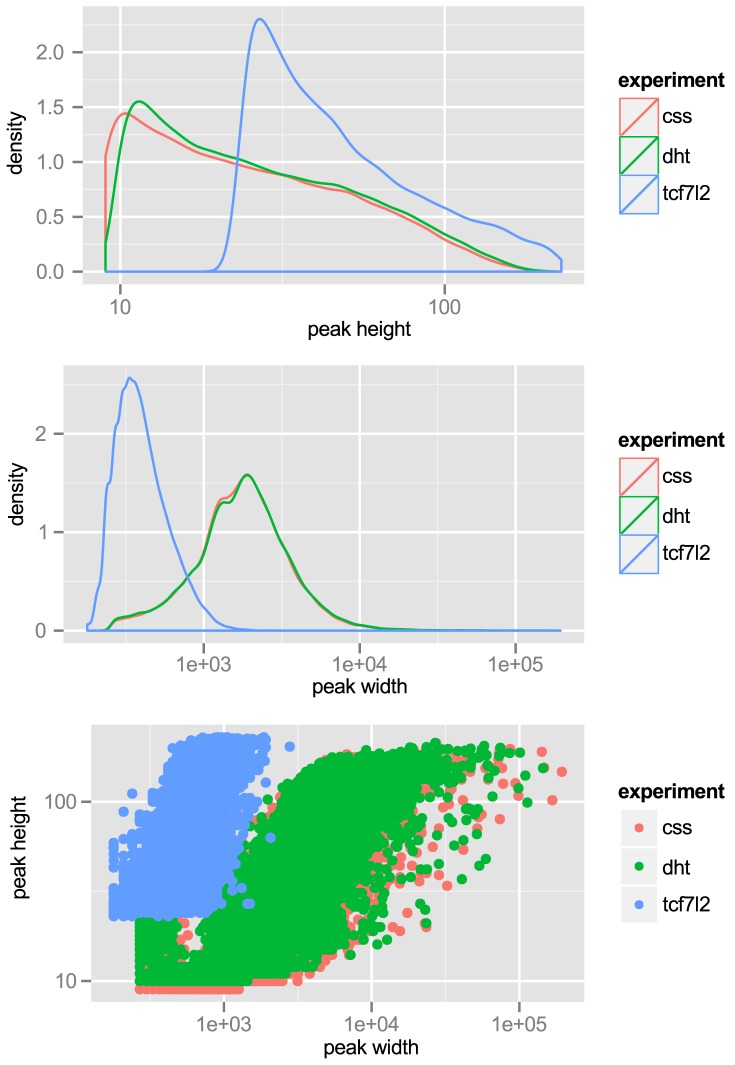
 is
is  scaled. Middle: peak width,
  -axis is
  scaled. Bottom: Peak height vs. width reveals strong correlation.
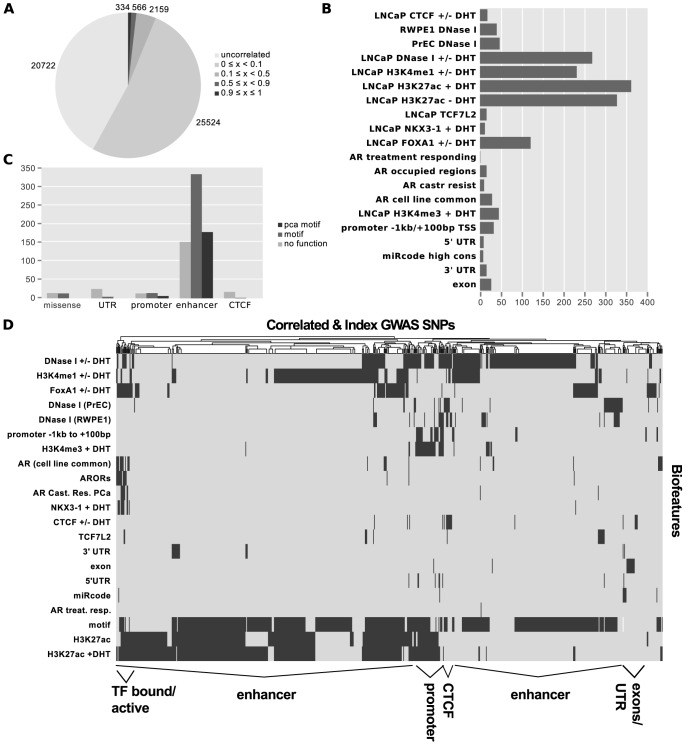
 are combined and summarized in A–D. A. SNP counts by
  value. B. SNP counts by biofeature. Some SNPs map to more than one biofeature, hence the total does not sum to 727. C. Classification of 727 SNPs by putative functional category. D. Supervised clustering of SNPs by biofeature.
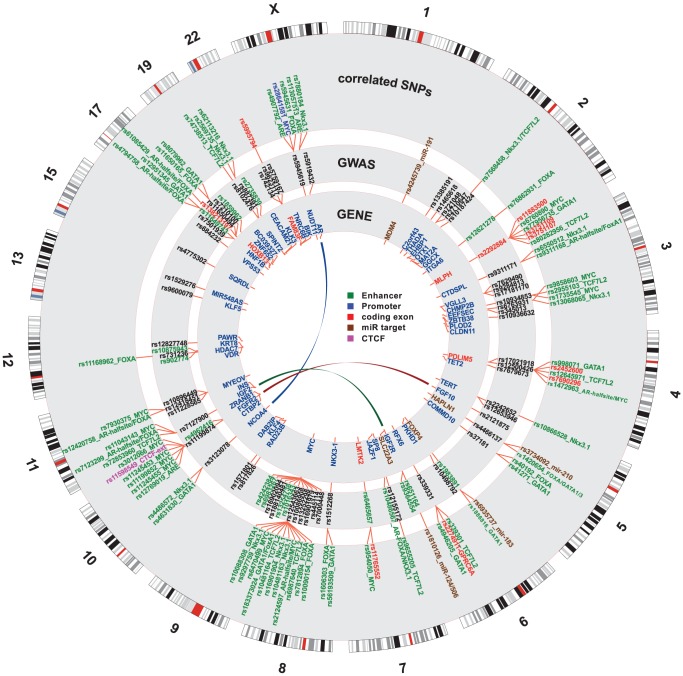
 SNPs. The links in the center highlight known biochemical interactors (e.g. receptor-ligand pairs). Index and correlated SNPs are color-coded by putative functional category (see Legend, center). Potentially disrupted response elements are also indicated for the correlated SNPs. The outermost ring shows the numbered chromosomes to scale with cytological banding patterns. The genome is displayed clockwise from top, with p displayed as the left arm of each chromosome and q as the right arm.
 -axis vs. number of regions. The dotted line indicates min. tag-density cutoff for the display.
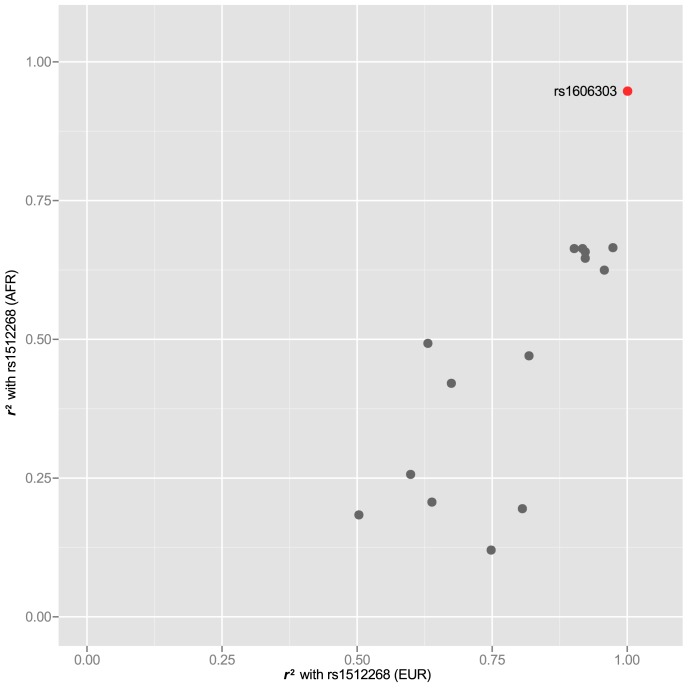
 kb downstream of the NKX3-1 gene. An
  reveals SNPs that are correlated to the index SNP in both populations for which it has been identified as carrying risk. One SNP that is highly correlated in populations of both African and European ancestry is highlighted in red.
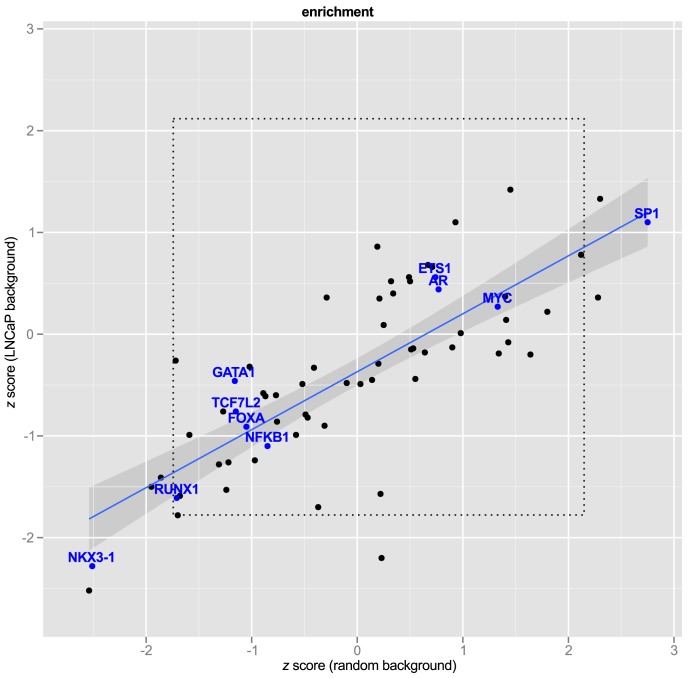
 express number of observed response element disruptions as a proportion relative to the standard deviation from the background distribution. The regression line is shown in blue with 95% confidence interval. Transcription factors of interest are highlighted with blue text. The inner box (dotted line) demarcates the 95% C.I. of a bootstrapped distribution for each PWM. A bonferroni box is outside the bounds of the graphic.
 labels).
References
-
- Manolio TA (2010) Genomewide association studies and assessment of the risk of disease. The New England journal of medicine 363: 166–176. - PubMed
-
- Horoszewicz JS, Leong SS, Kawinski E, Karr JP, Rosenthal H, et al. (1983) LNCaP model of human prostatic carcinoma. Cancer Research 43: 1809–1818. - PubMed
-
- Sobel R, Sadar M (2005) Cell lines used in prostate cancer research: a compendium of old and new linespart 1. The Journal of Urology 173: 342–359. - PubMed
Publication types
MeSH terms
Substances
Associated data
- Actions
Grants and funding
- U54 HG006996/HG/NHGRI NIH HHS/United States
- 11022/CRUK_/Cancer Research UK/United Kingdom
- R01 CA109147/CA/NCI NIH HHS/United States
- U19 CA148537/CA/NCI NIH HHS/United States
- 16563/CRUK_/Cancer Research UK/United Kingdom
- [CA109147/CA/NCI NIH HHS/United States
- 10118/CRUK_/Cancer Research UK/United Kingdom
- T32 GM067587/GM/NIGMS NIH HHS/United States
- U19CA148107/CA/NCI NIH HHS/United States
- 5T32CA009320-27/CA/NCI NIH HHS/United States
- 5T32GM067587/GM/NIGMS NIH HHS/United States
- T32 CA009320/CA/NCI NIH HHS/United States
- U19 CA148107/CA/NCI NIH HHS/United States
- U19CA148537/CA/NCI NIH HHS/United States
LinkOut - more resources
Full Text Sources
Other Literature Sources
Medical
Molecular Biology Databases
Research Materials
