The relationship between running velocity and the energy cost of turning during running
- PMID: 24497913
- PMCID: PMC3908867
- DOI: 10.1371/journal.pone.0081850
The relationship between running velocity and the energy cost of turning during running
Abstract
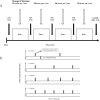
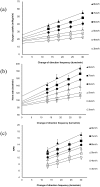
Ball game players frequently perform changes of direction (CODs) while running; however, there has been little research on the physiological impact of CODs. In particular, the effect of running velocity on the physiological and energy demands of CODs while running has not been clearly determined. The purpose of this study was to examine the relationship between running velocity and the energy cost of a 180°COD and to quantify the energy cost of a 180°COD. Nine male university students (aged 18-22 years) participated in the study. Five shuttle trials were performed in which the subjects were required to run at different velocities (3, 4, 5, 6, 7, and 8 km/h). Each trial consisted of four stages with different turn frequencies (13, 18, 24 and 30 per minute), and each stage lasted 3 minutes. Oxygen consumption was measured during the trial. The energy cost of a COD significantly increased with running velocity (except between 7 and 8 km/h, p = 0.110). The relationship between running velocity and the energy cost of a 180°COD is best represented by a quadratic function (y = -0.012+0.066x +0.008x(2), [r = 0.994, p = 0.001]), but is also well represented by a linear (y = -0.228+0.152x, [r = 0.991, p<0.001]). These data suggest that even low running velocities have relatively high physiological demands if the COD frequency increases, and that running velocities affect the physiological demands of CODs. These results also showed that the energy expenditure of COD can be evaluated using only two data points. These results may be useful for estimating the energy expenditure of players during a match and designing shuttle exercise training programs.
Conflict of interest statement
Figures


Similar articles
-
Energy Cost of Continuous Shuttle Running: Comparison of 4 Measurement Methods.J Strength Cond Res. 2018 Aug;32(8):2265-2272. doi: 10.1519/JSC.0000000000002366. J Strength Cond Res. 2018. PMID: 30044342
-
The physiological demands of hitting and running in tennis on different surfaces.J Strength Cond Res. 2010 Dec;24(12):3255-64. doi: 10.1519/JSC.0b013e3181e8745f. J Strength Cond Res. 2010. PMID: 21088546 Clinical Trial.
-
Kinematic algorithm to determine the energy cost of running with changes of direction.J Biomech. 2018 Jul 25;76:189-196. doi: 10.1016/j.jbiomech.2018.05.028. Epub 2018 Jun 15. J Biomech. 2018. PMID: 29934215
-
Specific aspects of contemporary triathlon: implications for physiological analysis and performance.Sports Med. 2002;32(6):345-59. doi: 10.2165/00007256-200232060-00001. Sports Med. 2002. PMID: 11980499 Review.
-
Significance of the velocity at VO2max and time to exhaustion at this velocity.Sports Med. 1996 Aug;22(2):90-108. doi: 10.2165/00007256-199622020-00004. Sports Med. 1996. PMID: 8857705 Review.
Cited by
-
A novel approach for measuring energy expenditure of a single sit-to-stand movement.Eur J Appl Physiol. 2016 May;116(5):997-1004. doi: 10.1007/s00421-016-3355-5. Epub 2016 Mar 26. Eur J Appl Physiol. 2016. PMID: 27017496
-
Energy Expenditure of a Single Sit-to-Stand Movement with Slow Versus Normal Speed Using the Different Frequency Accumulation Method.Medicina (Kaunas). 2019 Mar 25;55(3):77. doi: 10.3390/medicina55030077. Medicina (Kaunas). 2019. PMID: 30934628 Free PMC article.
-
Energy expenditure associated with walking speed and angle of turn in children.Eur J Appl Physiol. 2018 Dec;118(12):2563-2576. doi: 10.1007/s00421-018-3981-1. Epub 2018 Sep 5. Eur J Appl Physiol. 2018. PMID: 30187127 Free PMC article.
-
Comparison of Physiological and Perceptional Responses to 5-m Forward, Forward-Backward, and Lateral Shuttle Running.Front Physiol. 2022 Feb 17;12:780699. doi: 10.3389/fphys.2021.780699. eCollection 2021. Front Physiol. 2022. PMID: 35250602 Free PMC article.
-
Investigating the relationship between energy expenditure, walking speed and angle of turning in humans.PLoS One. 2017 Aug 10;12(8):e0182333. doi: 10.1371/journal.pone.0182333. eCollection 2017. PLoS One. 2017. PMID: 28796796 Free PMC article.
References
-
- Osgnach C, Poser S, Bernardini R, Rinaldo R, di Prampero PE (2010) Energy cost and metabolic power in elite soccer: a new match analysis approach. Med Sci Sports Exerc 42: 170–178. - PubMed
-
- Bangsbo J (1994) Energy demands in competitive soccer. J Sports Sci 12 Spec No: S5–12. - PubMed
-
- Ekblom B (1986) Applied physiology of soccer. Sports Med 3: 50–60. - PubMed
-
- Mohr M, Krustrup P, Bangsbo J (2005) Fatigue in soccer: a brief review. J Sports Sci 23: 593–599. - PubMed
-
- Reilly T, Thomas V (1979) Estimated daily energy expenditures of professional association footballers. Ergonomics 22: 541–548. - PubMed
Publication types
MeSH terms
LinkOut - more resources
Full Text Sources
Other Literature Sources

