. 2014 Jan 30;9(1):e86668.
doi: 10.1371/journal.pone.0086668. eCollection 2014.

Assessing the spatial dependence of adaptive loci in 43 European and Western Asian goat breeds using AFLP markers

Collaborators, Affiliations

Assessing the spatial dependence of adaptive loci in 43 European and Western Asian goat breeds using AFLP markers

Licia Colli et al. PLoS One. .

Abstract

Background: During the past decades, neutral DNA markers have been extensively employed to study demography, population genetics and structure in livestock, but less interest has been devoted to the evaluation of livestock adaptive potential through the identification of genomic regions likely to be under natural selection.

Methodology/principal findings: Landscape genomics can greatly benefit the entire livestock system through the identification of genotypes better adapted to specific or extreme environmental conditions. Therefore we analyzed 101 AFLP markers in 43 European and Western Asian goat breeds both with Matsam software, based on a correlative approach (SAM), and with Mcheza and Bayescan, two FST based software able to detect markers carrying signatures of natural selection. Matsam identified four loci possibly under natural selection--also confirmed by FST-outlier methods--and significantly associated with environmental variables such as diurnal temperature range, frequency of precipitation, relative humidity and solar radiation.

Conclusions/significance: These results show that landscape genomics can provide useful information on the environmental factors affecting the adaptive potential of livestock living in specific climatic conditions. Besides adding conservation value to livestock genetic resources, this knowledge may lead to the development of novel molecular tools useful to preserve the adaptive potential of local breeds during genetic improvement programs, and to increase the adaptability of industrial breeds to changing environments.


Conflict of interest statement

Competing Interests: The authors have declared that no competing interests exist.

Figures

Figure 1
Figure 1. Number of significant models identified by MATSAM for the most significant confidence levels.
Number of models identified by Matsam, Bayescan and Mcheza (panel A) and by Matsam alone (panel B) at different levels of statistical significance (Wald test). The colour shades vary from dark green = large number of significant associations, to red = no significant associations.
Figure 2
Figure 2. Outlier loci identified by BayeScan.
Axis X shows the posterior odds (PO), i.e. the ratio between the posterior probability (PP) of the model with selection and the PP of the neutral model. The Y axis shows the FST index values.
Figure 3
Figure 3. The four AFLP markers most significantly associated with environmental variables.
From left to right: the average frequency of the marker over the whole study area; the Posterior Probability for the marker to be under selection provided by BayeScan; the FST value provided by Mcheza; the detail of monthly or yearly environmental variables associated with the corresponding marker.
Figure 4
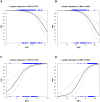
Figure 4. Logistic regression of marker M16 on four environmental variables.
Results of the logistic regression of marker M16 on A) yearly mean of diurnal temperature range (DTR), B) yearly mean of the percentage of maximum possible sunshine (SUN), C) frequency of precipitation in November (RDO), and D) relative humidity in October (REH). Blue dots represent locations where the band is present (1) or absent (0). Grey lines show the upper and the lower limit of the confidence interval at 99.9%.
Figure 5
Figure 5. Clusters resulting from the bivariate LISA analysis of the frequency of marker M16.
The plot shows the distribution of the clusters obtained from the bivariate LISA analysis of the correlation of the frequency of marker M16 with the weighted values of the environmental variable “number of days with more than 0.1 mm of rain in November”. The colors of the cluster correspond to different spatial autocorrelation regimes: red = high marker frequencies correlated with high mean of environmental variables values measured at the nearest 90 neighbouring farms (see the text for further details); blue = low marker frequency correlated with low environmental variable values; purple = low marker frequency correlated with high environmental variable values; pale red = high marker frequency correlated with low environmental variable values. Locations with frequencies showing no spatial dependence are displayed in white.
Figure 6
Figure 6. Clusters resulting from the bivariate LISA analysis of the frequency of marker M86.
The plot shows the distribution of the clusters obtained from the bivariate LISA analysis of the correlation of the frequency of marker M86 compared with the weighted values of the environmental variable “percentage of maximum possible sunshine in March”. The colors of the cluster correspond to different spatial autocorrelation regimes, as explained in Figure 5.

References

    1. Avise JC (2004) Molecular Markers, Natural History and Evolution. Sunderland Massachusetts: 2nd edn. Sinauer Associates. 684 p.
    1. Cañón J, García D, García-Atance MA, Obexer-Ruff G, Lenstra JA, et al. (2006) Geographical partitioning of goat diversity in Europe and the Middle East. Anim Genet 37: 327–334. - PubMed
    1. SanCristobal M, Chevalet C, Peleman J, Heuven H, Brugmans B, et al. (2006) Genetic diversity in European pigs utilizing amplified fragment length polymorphism markers. Anim Genet 37: 232–238. - PubMed
    1. Luikart G, England PR, Tallmon D, Jordan S, Taberlet P (2003) The power and promise of population genomics: from genotyping to genome typing. Nat Rev Genet 4: 981–994. - PubMed
    1. Vasemägi A, Primmer CR (2005) Challenges for identifying functionally important genetic variation: the promise of combining complementary research strategies. Mol Ecol 14: 3623–3642. - PubMed

Publication types

Substances