

Genetic structure and hierarchical population divergence history of Acer mono var. mono in South and Northeast China
- PMID: 24498039
- PMCID: PMC3909053
- DOI: 10.1371/journal.pone.0087187
Genetic structure and hierarchical population divergence history of Acer mono var. mono in South and Northeast China
Abstract
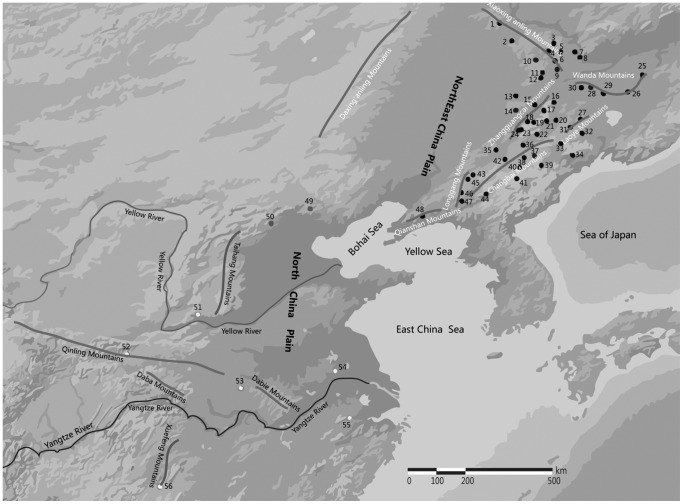
Knowledge of the genetic structure and evolutionary history of tree species across their ranges is essential for the development of effective conservation and forest management strategies. Acer mono var. mono, an economically and ecologically important maple species, is extensively distributed in Northeast China (NE), whereas it has a scattered and patchy distribution in South China (SC). In this study, the genetic structure and demographic history of 56 natural populations of A. mono var. mono were evaluated using seven nuclear microsatellite markers. Neighbor-joining tree and STRUCTURE analysis clearly separated populations into NE and SC groups with two admixed-like populations. Allelic richness significantly decreased with increasing latitude within the NE group while both allelic richness and expected heterozygosity showed significant positive correlation with latitude within the SC group. Especially in the NE region, previous studies in Quercus mongolica and Fraxinus mandshurica have also detected reductions in genetic diversity with increases in latitude, suggesting this pattern may be common for tree species in this region, probably due to expansion from single refugium following the last glacial maximum (LGM). Approximate Bayesian Computation-based analysis revealed two major features of hierarchical population divergence in the species' evolutionary history. Recent divergence between the NE group and the admixed-like group corresponded to the LGM period and ancient divergence of SC groups took place during mid-late Pleistocene period. The level of genetic differentiation was moderate (FST = 0.073; G'ST = 0.278) among all populations, but significantly higher in the SC group than the NE group, mirroring the species' more scattered distribution in SC. Conservation measures for this species are proposed, taking into account the genetic structure and past demographic history identified in this study.
Conflict of interest statement
Figures


References
-
- Fu LG (1992) China Plant Red Data Book, Rare and Endangered Plants (Vol. 1). Beijing: Chinese Science Press. 385–387p (in Chinese).
-
- Li WH (2004) Degradation and restoration of forest ecosystems in China. For Ecol Manage 201: 33–41.
-
- Zhu JJ, Mao ZH, Hu LL, Zhang JX (2007) Plant diversity of secondary forests in response to anthropogenic disturbance levels in montane regions of northeastern China. J For Res 12: 403–416.
-
- Moritz C (2002) Strategies to protect biological diversity and the evolutionary process that sustain it. Syst Biol 51: 238–254. - PubMed
-
- Escudero A, Iriondo JM, Torres ME (2003) Spatial analysis of genetic diversity as a tool for plant conservation. Biol Conserv 113: 351–365.
Publication types
MeSH terms
LinkOut - more resources
Full Text Sources
Other Literature Sources
Research Materials
Miscellaneous
