Clinical Trial
. 2014 Jan 31;9(1):e87515.
doi: 10.1371/journal.pone.0087515. eCollection 2014.

Quantification of tortuosity and fractal dimension of the lung vessels in pulmonary hypertension patients

Affiliations
Clinical Trial

Quantification of tortuosity and fractal dimension of the lung vessels in pulmonary hypertension patients

Michael Helmberger et al. PLoS One. .

Abstract

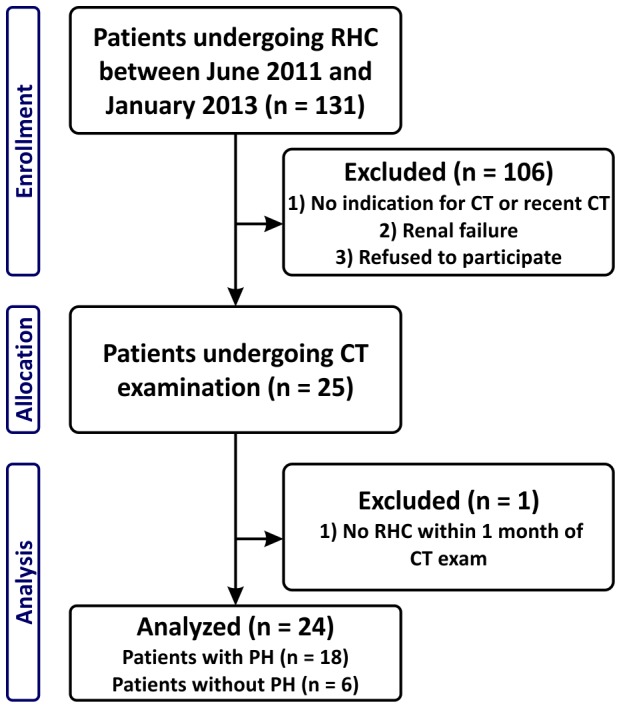
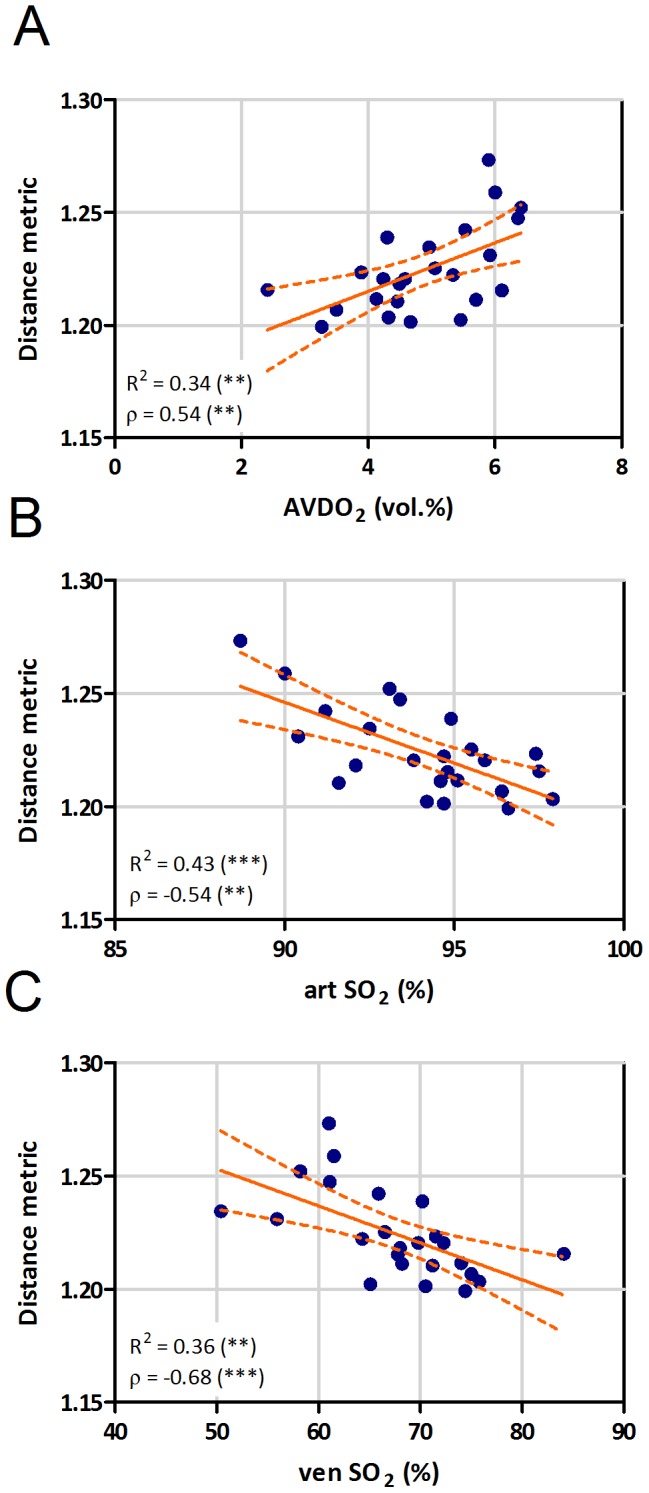
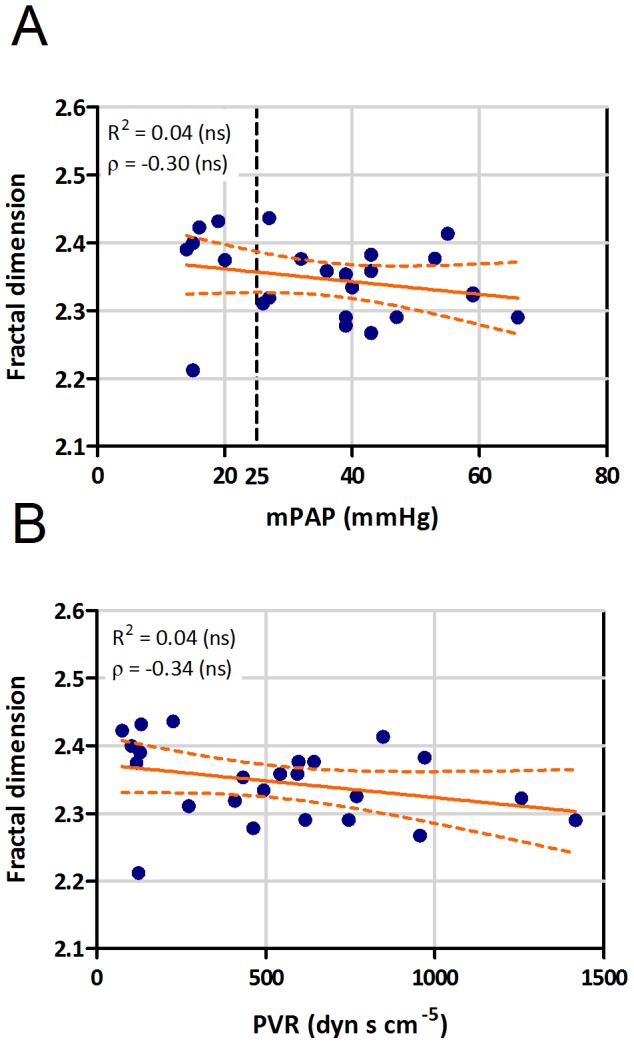
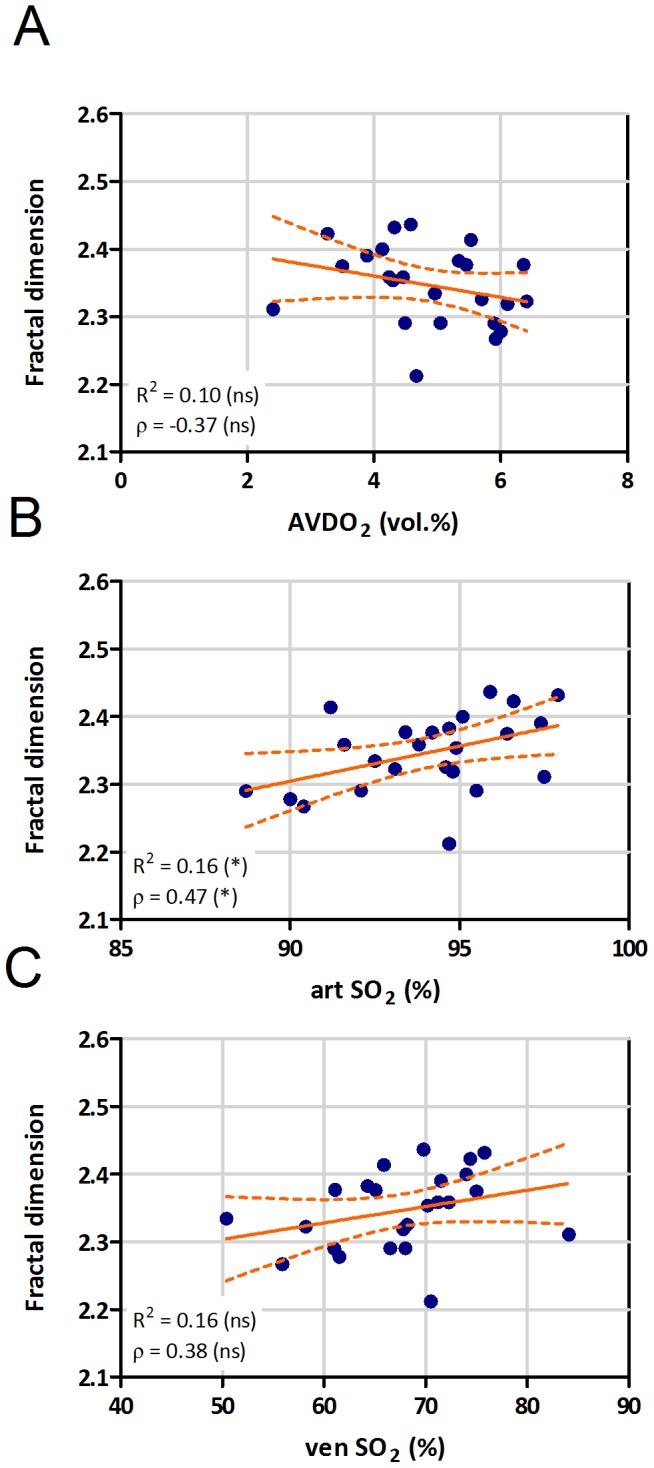
Pulmonary hypertension (PH) can result in vascular pruning and increased tortuosity of the blood vessels. In this study we examined whether automatic extraction of lung vessels from contrast-enhanced thoracic computed tomography (CT) scans and calculation of tortuosity as well as 3D fractal dimension of the segmented lung vessels results in measures associated with PH. In this pilot study, 24 patients (18 with and 6 without PH) were examined with thorax CT following their diagnostic or follow-up right-sided heart catheterisation (RHC). Images of the whole thorax were acquired with a 128-slice dual-energy CT scanner. After lung identification, a vessel enhancement filter was used to estimate the lung vessel centerlines. From these, the vascular trees were generated. For each vessel segment the tortuosity was calculated using distance metric. Fractal dimension was computed using 3D box counting. Hemodynamic data from RHC was used for correlation analysis. Distance metric, the readout of vessel tortuosity, correlated with mean pulmonary arterial pressure (Spearman correlation coefficient: ρ = 0.60) and other relevant parameters, like pulmonary vascular resistance (ρ = 0.59), arterio-venous difference in oxygen (ρ = 0.54), arterial (ρ = -0.54) and venous oxygen saturation (ρ = -0.68). Moreover, distance metric increased with increase of WHO functional class. In contrast, 3D fractal dimension was only significantly correlated with arterial oxygen saturation (ρ = 0.47). Automatic detection of the lung vascular tree can provide clinically relevant measures of blood vessel morphology. Non-invasive quantification of pulmonary vessel tortuosity may provide a tool to evaluate the severity of pulmonary hypertension.

Trial registration: ClinicalTrials.gov NCT01607489.


Conflict of interest statement

Competing Interests: G. Kovacs reports personal fees from Glaxo Smithkline, personal fees from Actelion, personal fees from Pfizer, personal fees from Boehringer Ingelheim, personal fees from Astra Zeneca, personal fees from Nycomed-Takeda, personal fees from Bayer, personal fees from Chiesi, outside the submitted work. H. Olschewski reports personal fees from Ludwig Boltzmann Institute for Lung Vascular Research, during the conduct of the study; grants and personal fees from Actelion, grants and personal fees from Bayer, personal fees from Chiesi, personal fees from Gilead, personal fees from Lilly, personal fees from Boehringer, personal fees from Almirall, personal fees from Pfizer, grants and personal fees from GSK, personal fees from Astra Zeneca, personal fees from Novartis, personal fees from Takeda, outside the submitted work. PK is radiologist in the private practice of radiologists, DiagnostikZentrum Graz. This does not alter the authors' adherence to all the PLOS ONE policies on sharing data and materials.

Figures

Figure 1
Figure 1. Flowchart of patient recruitment.
RHC =  right-sided heart catheterization, CT =  computed tomography, PH =  pulmonary hypertension
Figure 2
Figure 2. Flowchart of the automatic vessel extraction algorithm.
(top) Sample CT image, (2nd row) lung, airway segmentation and the vessel enhancement filter response superimposed on the CT image, (3rd row) vessel enhancement filter response restricted to the region of interest, (bottom row, left) connected centerlines, (bottom row, right) 3D rendering of the lung vessel centerlines. Inset shows the computation of distance metric (DM). The sum of distances along the 3D points of the vessel is divided by the length of the straight path between the two endpoints (first and last 3D point of the vessel segment).
Figure 3
Figure 3. Correlation of distance metric with patient clinical parameters.
Correlation of distance metric with (A) mean pulmonary arterial pressure (mPAP), and (B) pulmonary vascular resistance (PVR; R =  linear correlation coefficient, r =  Spearman correlation coefficient, ** p<0.01, *** p<0.001). (C) Receiver-operating curve for DM determining mPAP >25 mmHg (AUC: area under the curve). (D) Distribution of distance metric according to the WHO classification of the patients. (solid lines represent mean and standard error of mean; p value shows significant difference between WHO class II and III).
Figure 4
Figure 4. Correlation of distance metric with oxygen exchange parameters.
Correlation of distance metric with arterio-venous difference in oxygen content (AVDO2, A), arterial (art SO2, B) and venous (ven SO2, C) oxygen saturation (R =  linear correlation coefficient, ρ = Spearman correlation coefficient, ** p<0.01, *** p<0.001).
Figure 5
Figure 5. Correlation of fractal dimension with clinical parameters.
Correlation of 3D fractal dimension (FD) with (A) mean pulmonary arterial pressure (mPAP), and (B) pulmonary vascular resistance (PVR; R =  linear correlation coefficient, ρ =  Spearman correlation coefficient, ns - not significant).
Figure 6
Figure 6. Correlation of fractal dimension with oxygen exchange parameters.
Correlation of 3D fractal dimension with arterio-venous difference in oxygen content (AVDO2, A), arterial (art SO2, B) and venous (ven SO2, C) oxygen saturation (R =  linear correlation coefficient, ρ =  Spearman correlation coefficient, * p<0.05, ns - not significant).

Similar articles

Cited by

References

    1. Galie N, Hoeper MM, Humbert M, Torbicki A, Vachiery J, et al. (2009) Guidelines for the diagnosis and treatment of pulmonary hypertension. Eur Resp J 34: 1219–1263. - PubMed
    1. Simonneau G, Robbins IM, Beghetti M, Channick RN, Delcroix M, et al. (2009) Updated clinical classification of pulmonary hypertension. J Am Coll Cardiol 54: S43–S54. - PubMed
    1. Okajima Y, Ohno Y, Washko GR, Hatabu H (2011) Assessment of pulmonary hypertension: What CT and MRI can provide. Acad Radiol 18: 437–453. - PubMed
    1. Stevens GR, Fida N, Sanz J (2012) Computed tomography and cardiac magnetic resonance imaging in pulmonary hypertension. Prog Cardiovasc Dis 55: 161–171. - PubMed
    1. Kulik TJ, Clark RL, Hasan BS, Keane JF, Springmuller D, et al. (2011) Pulmonary arterial hypertension: What the large pulmonary arteries tell us. Pediatr Cardiol 32: 759–765. - PubMed

Publication types

Associated data