

Correlations between the signal complexity of cerebral and cardiac electrical activity: a multiscale entropy analysis
- PMID: 24498375
- PMCID: PMC3912068
- DOI: 10.1371/journal.pone.0087798
Correlations between the signal complexity of cerebral and cardiac electrical activity: a multiscale entropy analysis
Abstract
The heart begins to beat before the brain is formed. Whether conventional hierarchical central commands sent by the brain to the heart alone explain all the interplay between these two organs should be reconsidered. Here, we demonstrate correlations between the signal complexity of brain and cardiac activity. Eighty-seven geriatric outpatients with healthy hearts and varied cognitive abilities each provided a 24-hour electrocardiography (ECG) and a 19-channel eye-closed routine electroencephalography (EEG). Multiscale entropy (MSE) analysis was applied to three epochs (resting-awake state, photic stimulation of fast frequencies (fast-PS), and photic stimulation of slow frequencies (slow-PS)) of EEG in the 1-58 Hz frequency range, and three RR interval (RRI) time series (awake-state, sleep and that concomitant with the EEG) for each subject. The low-to-high frequency power (LF/HF) ratio of RRI was calculated to represent sympatho-vagal balance. With statistics after Bonferroni corrections, we found that: (a) the summed MSE value on coarse scales of the awake RRI (scales 11-20, RRI-MSE-coarse) were inversely correlated with the summed MSE value on coarse scales of the resting-awake EEG (scales 6-20, EEG-MSE-coarse) at Fp2, C4, T6 and T4; (b) the awake RRI-MSE-coarse was inversely correlated with the fast-PS EEG-MSE-coarse at O1, O2 and C4; (c) the sleep RRI-MSE-coarse was inversely correlated with the slow-PS EEG-MSE-coarse at Fp2; (d) the RRI-MSE-coarse and LF/HF ratio of the awake RRI were correlated positively to each other; (e) the EEG-MSE-coarse at F8 was proportional to the cognitive test score; (f) the results conform to the cholinergic hypothesis which states that cognitive impairment causes reduction in vagal cardiac modulation; (g) fast-PS significantly lowered the EEG-MSE-coarse globally. Whether these heart-brain correlations could be fully explained by the central autonomic network is unknown and needs further exploration.
Conflict of interest statement
Figures


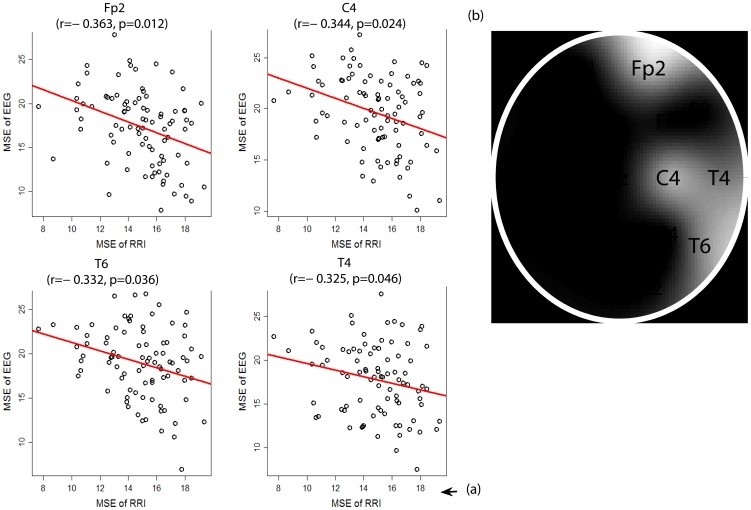
 19, alpha = 0.05). r and p denote the Pearson’s partial correlation coefficient and corrected significance level, respectively. (b) The brain map illustrates regions with significant association. The relative brightness is according to the sequential p-values from the smallest one (Fp2, C4, T6 and T4).
 19, alpha = 0.05). r and p denote the Pearson’s partial correlation coefficient and corrected significance level, respectively. (b) The brain map illustrates regions with significant association. The relative brightness is according to the sequential p-values from the smallest one (O1, O2 and C4).
Similar articles
-
Age-related variation in EEG complexity to photic stimulation: a multiscale entropy analysis.Clin Neurophysiol. 2009 Mar;120(3):476-83. doi: 10.1016/j.clinph.2008.12.043. Epub 2009 Feb 23. Clin Neurophysiol. 2009. PMID: 19231279 Free PMC article.
-
Cognitive and neuropsychiatric correlates of EEG dynamic complexity in patients with Alzheimer's disease.Prog Neuropsychopharmacol Biol Psychiatry. 2013 Dec 2;47:52-61. doi: 10.1016/j.pnpbp.2013.07.022. Epub 2013 Aug 13. Prog Neuropsychopharmacol Biol Psychiatry. 2013. PMID: 23954738
-
Neurophysiological basis of creativity in healthy elderly people: a multiscale entropy approach.Clin Neurophysiol. 2015 Mar;126(3):524-31. doi: 10.1016/j.clinph.2014.06.032. Epub 2014 Jul 6. Clin Neurophysiol. 2015. PMID: 25066939
-
Hypoglycemia-related electroencephalogram changes assessed by multiscale entropy.Diabetes Technol Ther. 2014 Oct;16(10):688-94. doi: 10.1089/dia.2013.0331. Epub 2014 Jun 3. Diabetes Technol Ther. 2014. PMID: 24892361 Review.
-
EEG entropy insights in the context of physiological aging and Alzheimer's and Parkinson's diseases: a comprehensive review.Geroscience. 2024 Dec;46(6):5537-5557. doi: 10.1007/s11357-024-01185-1. Epub 2024 May 22. Geroscience. 2024. PMID: 38776044 Free PMC article. Review.
Cited by
-
Complexity of cardiac signals for predicting changes in alpha-waves after stress in patients undergoing cardiac catheterization.Sci Rep. 2015 Aug 19;5:13315. doi: 10.1038/srep13315. Sci Rep. 2015. PMID: 26286628 Free PMC article.
-
Intrinsic multi-scale analysis: a multi-variate empirical mode decomposition framework.Proc Math Phys Eng Sci. 2015 Jan 8;471(2173):20140709. doi: 10.1098/rspa.2014.0709. Proc Math Phys Eng Sci. 2015. PMID: 25568621 Free PMC article. Review.
-
Acute Effects of Various Movement Noise in Differential Learning of Rope Skipping on Brain and Heart Recovery Analyzed by Means of Multiscale Fuzzy Measure Entropy.Front Behav Neurosci. 2022 Feb 25;16:816334. doi: 10.3389/fnbeh.2022.816334. eCollection 2022. Front Behav Neurosci. 2022. PMID: 35283739 Free PMC article.
-
A Heartbeat Away From Consciousness: Heart Rate Variability Entropy Can Discriminate Disorders of Consciousness and Is Correlated With Resting-State fMRI Brain Connectivity of the Central Autonomic Network.Front Neurol. 2018 Sep 12;9:769. doi: 10.3389/fneur.2018.00769. eCollection 2018. Front Neurol. 2018. PMID: 30258400 Free PMC article.
-
Improved Multiscale Entropy Technique with Nearest-Neighbor Moving-Average Kernel for Nonlinear and Nonstationary Short-Time Biomedical Signal Analysis.J Healthc Eng. 2018 Mar 5;2018:8632436. doi: 10.1155/2018/8632436. eCollection 2018. J Healthc Eng. 2018. PMID: 29707188 Free PMC article.
References
-
- Benarroch EE (1993) The central autonomic network: functional organization, dysfunction, and perspective. Mayo Clin Proc 68: 988–1001. - PubMed
-
- Thayer JF, Lane RD (2009) Claude Bernard and the heart-brain connection: further elaboration of a model of neurovisceral integration. Neurosci Biobehav Rev 33: 81–88. - PubMed
-
- Dufey M, Hurtado E, Fernandez AM, Manes F, Ibanez A (2011) Exploring the relationship between vagal tone and event-related potentials in response to an affective picture task. Soc Neurosci 6: 48–62. - PubMed
-
- Leppanen PH, Guttorm TK, Pihko E, Takkinen S, Eklund KM, et al. (2004) Maturational effects on newborn ERPs measured in the mismatch negativity paradigm. Exp Neurol 190 Suppl 1S91–101. - PubMed
-
- Armour JA (2011) Physiology of the intrinsic cardiac nervous system. Heart Rhythm 8: 739. - PubMed
Publication types
MeSH terms
LinkOut - more resources
Full Text Sources
Other Literature Sources
Medical
Research Materials
Miscellaneous
