

Differentially expressed proteins in malignant and benign adrenocortical tumors
- PMID: 24498411
- PMCID: PMC3912167
- DOI: 10.1371/journal.pone.0087951
Differentially expressed proteins in malignant and benign adrenocortical tumors
Abstract
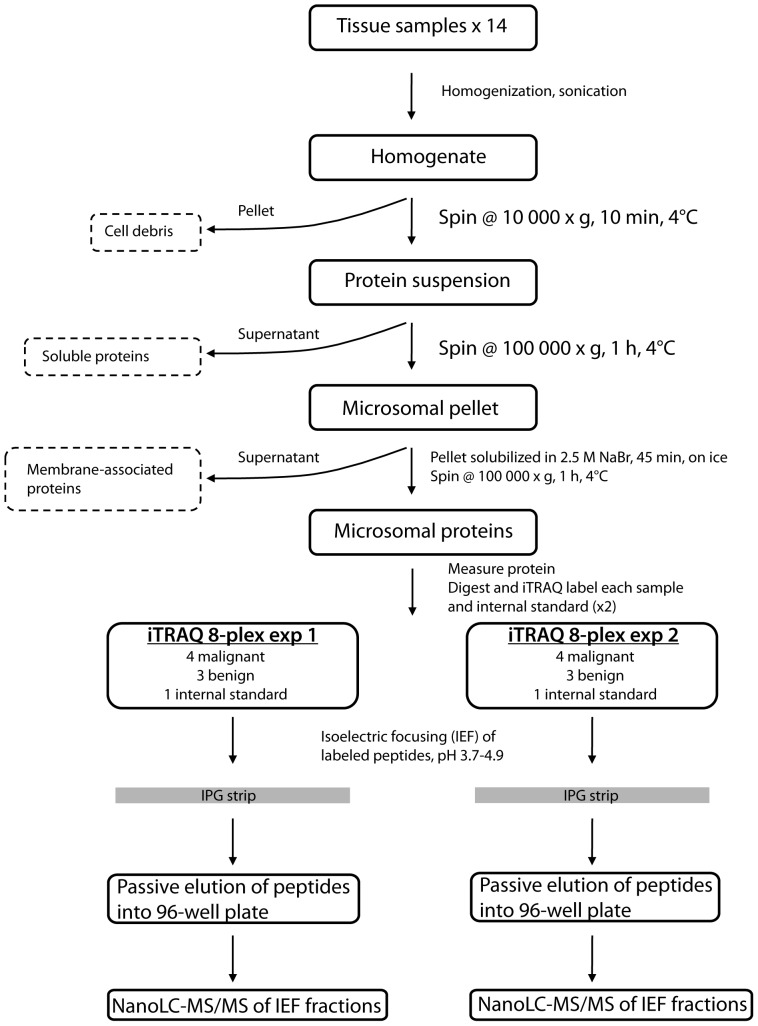
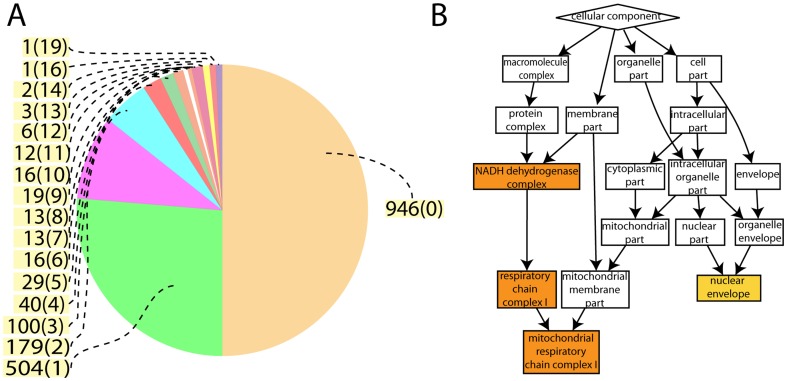
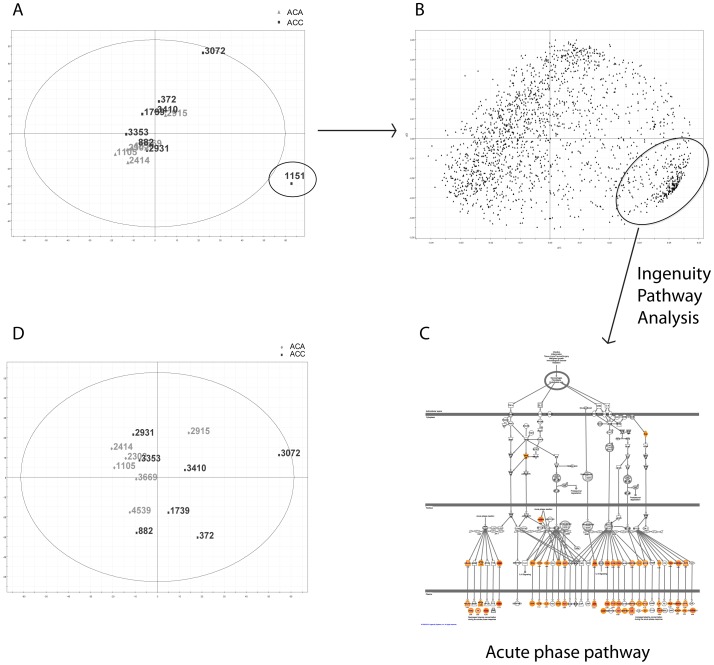
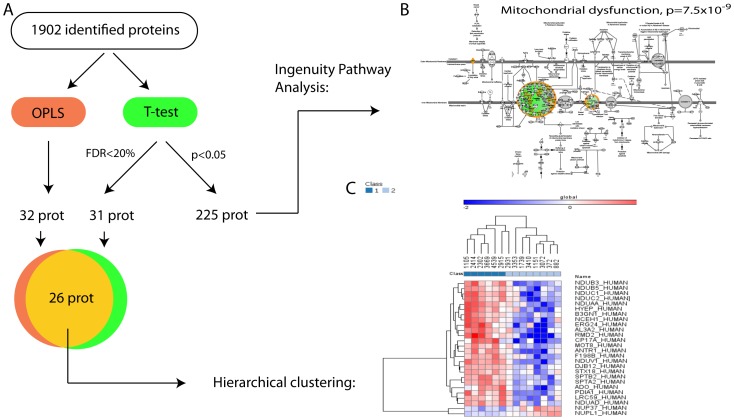
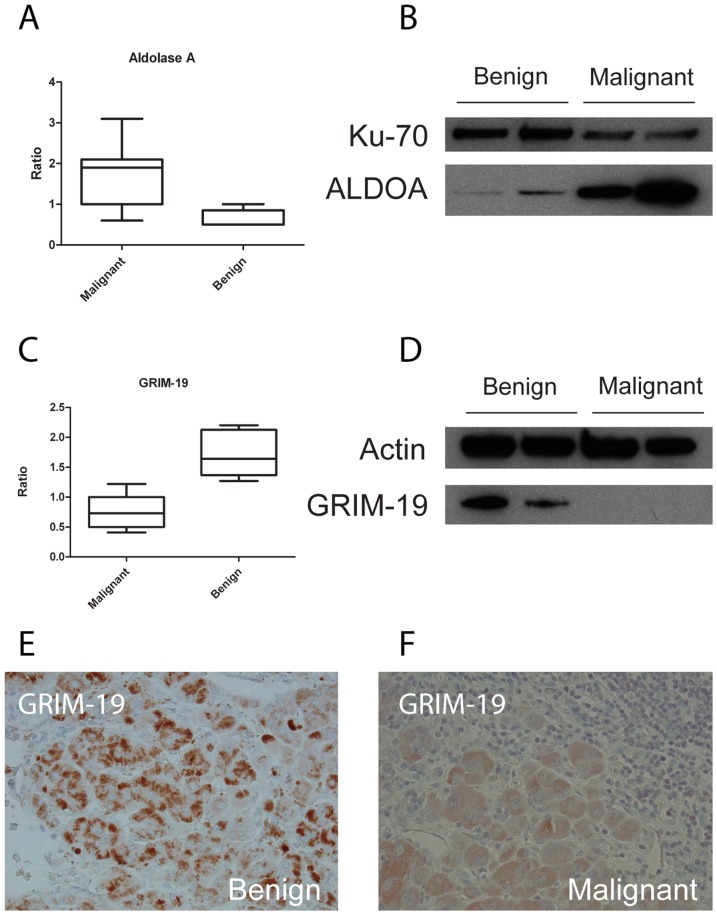
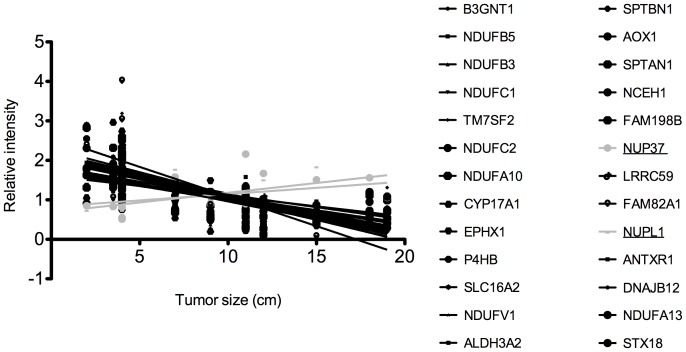
We have compared the microsomal protein composition of eight malignant and six benign adrenocortical tumors with proteomic methods. IGF2 had increased level in the malignant tumors, confirming previous microarray studies on the same material. Aldolase A, a glycolytic enzyme, also showed increased levels in the malignant tissue compared to the benign. Additionally, several proteins belonging to complex I in the mitochondrial respiration chain showed decreased levels in the malignant tissue. Taken together, this may indicate a shift in energy metabolism where glycolysis may be favored over tight coupling of glycolysis and mitochondrial respiration, a phenomenon known as the Warburg effect. One of the complex I proteins that showed decreased levels in the malignant tissue was GRIM-19. This protein has been suggested as a tumor suppressive protein by being a negative regulator of STAT3. In summary, an analysis of the microsomal proteome in adrenocortical tumors identifies groups of proteins as well as specific proteins differentially expressed in the benign and malignant forms. These proteins shed light on the biology behind malignancy and could delineate future drug targets.
Conflict of interest statement
Figures
Similar articles
-
Increased levels of insulin-like growth factor II (IGF-II) and IGF-binding protein-2 are associated with malignancy in sporadic adrenocortical tumors.J Clin Endocrinol Metab. 1998 May;83(5):1713-20. doi: 10.1210/jcem.83.5.4816. J Clin Endocrinol Metab. 1998. PMID: 9589681
-
The differential diagnosis of adrenocortical tumors: systematic review of Ki-67 and IGF2 and meta-analysis of Ki-67.Rev Endocr Metab Disord. 2025 Apr;26(2):261-278. doi: 10.1007/s11154-025-09945-w. Epub 2025 Jan 31. Rev Endocr Metab Disord. 2025. PMID: 39890749 Free PMC article.
-
MicroRNA profiling of adrenocortical tumors reveals miR-483 as a marker of malignancy.Cancer. 2011 Apr 15;117(8):1630-9. doi: 10.1002/cncr.25724. Epub 2010 Nov 8. Cancer. 2011. PMID: 21472710 Free PMC article.
-
High expression of cyclin E and G1 CDK and loss of function of p57KIP2 are involved in proliferation of malignant sporadic adrenocortical tumors.J Clin Endocrinol Metab. 2000 Jan;85(1):322-30. doi: 10.1210/jcem.85.1.6303. J Clin Endocrinol Metab. 2000. PMID: 10634406
-
Differences in the molecular mechanisms of adrenocortical tumorigenesis between children and adults.Mol Cell Endocrinol. 2012 Mar 31;351(1):52-7. doi: 10.1016/j.mce.2011.09.040. Epub 2011 Oct 14. Mol Cell Endocrinol. 2012. PMID: 22019901 Review.
Cited by
-
Altered expression of the IGF2‑H19 locus and mitochondrial respiratory complexes in adrenocortical carcinoma.Int J Oncol. 2022 Nov;61(5):140. doi: 10.3892/ijo.2022.5430. Epub 2022 Sep 28. Int J Oncol. 2022. PMID: 36169175 Free PMC article.
-
MiR-486-3p was downregulated at microRNA profiling of adrenals of multiple endocrine neoplasia type 1 mice, and inhibited human adrenocortical carcinoma cell lines.Sci Rep. 2021 Jul 20;11(1):14772. doi: 10.1038/s41598-021-94154-z. Sci Rep. 2021. PMID: 34285285 Free PMC article.
-
2D-DIGE proteomic analysis identifies new potential therapeutic targets for adrenocortical carcinoma.Oncotarget. 2015 Mar 20;6(8):5695-706. doi: 10.18632/oncotarget.3299. Oncotarget. 2015. PMID: 25691058 Free PMC article.
-
GRIM-19: A master regulator of cytokine induced tumor suppression, metastasis and energy metabolism.Cytokine Growth Factor Rev. 2017 Feb;33:1-18. doi: 10.1016/j.cytogfr.2016.09.001. Epub 2016 Sep 15. Cytokine Growth Factor Rev. 2017. PMID: 27659873 Free PMC article. Review.
-
Oncostatic-Cytoprotective Effect of Melatonin and Other Bioactive Molecules: A Common Target in Mitochondrial Respiration.Int J Mol Sci. 2016 Mar 7;17(3):341. doi: 10.3390/ijms17030341. Int J Mol Sci. 2016. PMID: 26959015 Free PMC article. Review.
References
-
- Hedeland H, Ostberg G, Hokfelt B (1968) On the prevalence of adrenocortical adenomas in an autopsy material in relation to hypertension and diabetes. Acta Med Scand 184: 211–214. - PubMed
-
- Dackiw AP, Lee JE, Gagel RF, Evans DB (2001) Adrenal cortical carcinoma. World J Surg 25: 914–926. - PubMed
-
- Wandoloski M, Bussey KJ, Demeure MJ (2009) Adrenocortical cancer. Surg Clin North Am 89: 1255–1267. - PubMed
-
- Anagnostis P, Karagiannis A, Tziomalos K, Kakafika AI, Athyros VG, et al. (2009) Adrenal incidentaloma: a diagnostic challenge. Hormones (Athens) 8: 163–184. - PubMed
-
- Kufe DW, Pollock RE, Weichselbaum RR, Bast RC Jr, Gansler TS, et al. (2003) Cancer Medicine 6. London: BC Decker Inc.
Publication types
MeSH terms
Substances
LinkOut - more resources
Full Text Sources
Other Literature Sources
Molecular Biology Databases
Miscellaneous
