

Disentangling working memory processes during spatial span assessment: a modeling analysis of preferred eye movement strategies
- PMID: 24499103
- PMCID: PMC3970432
- DOI: 10.1080/13803395.2013.877123
Disentangling working memory processes during spatial span assessment: a modeling analysis of preferred eye movement strategies
Abstract
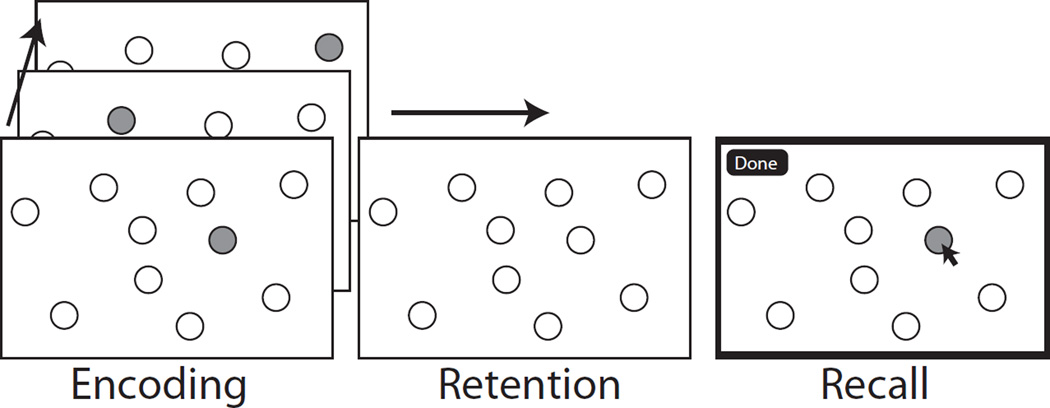
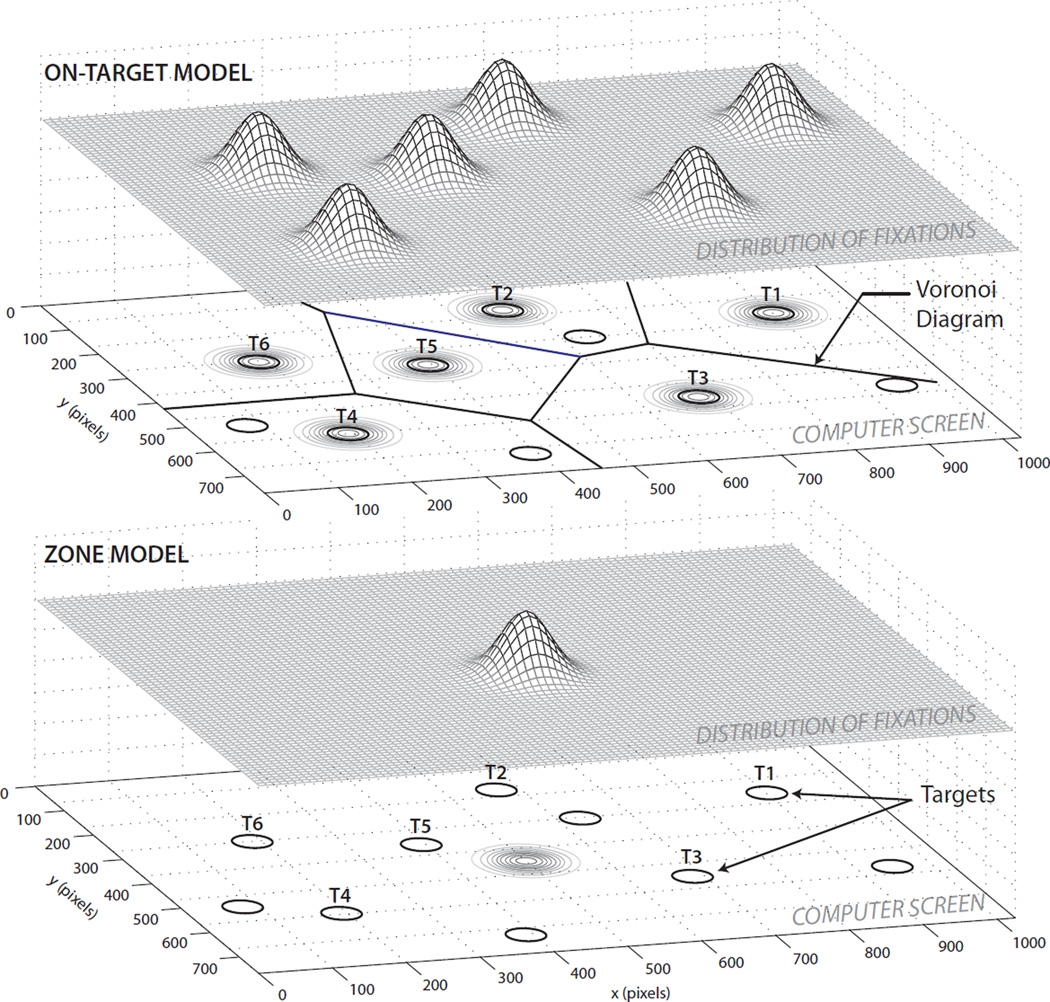
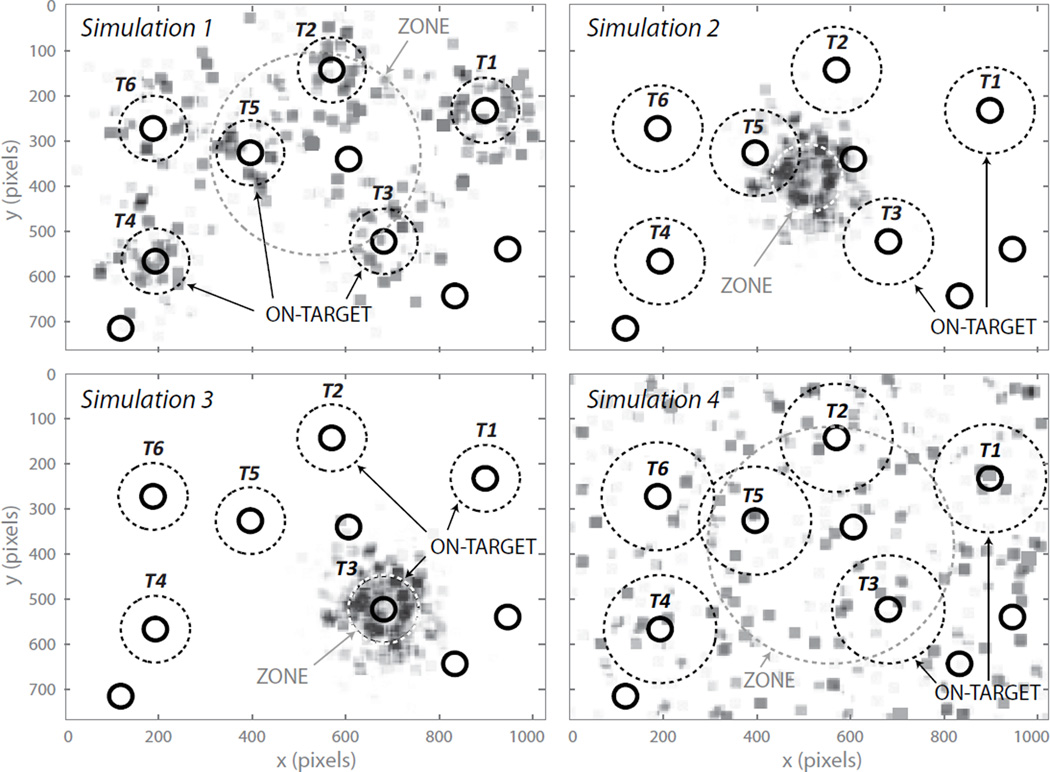
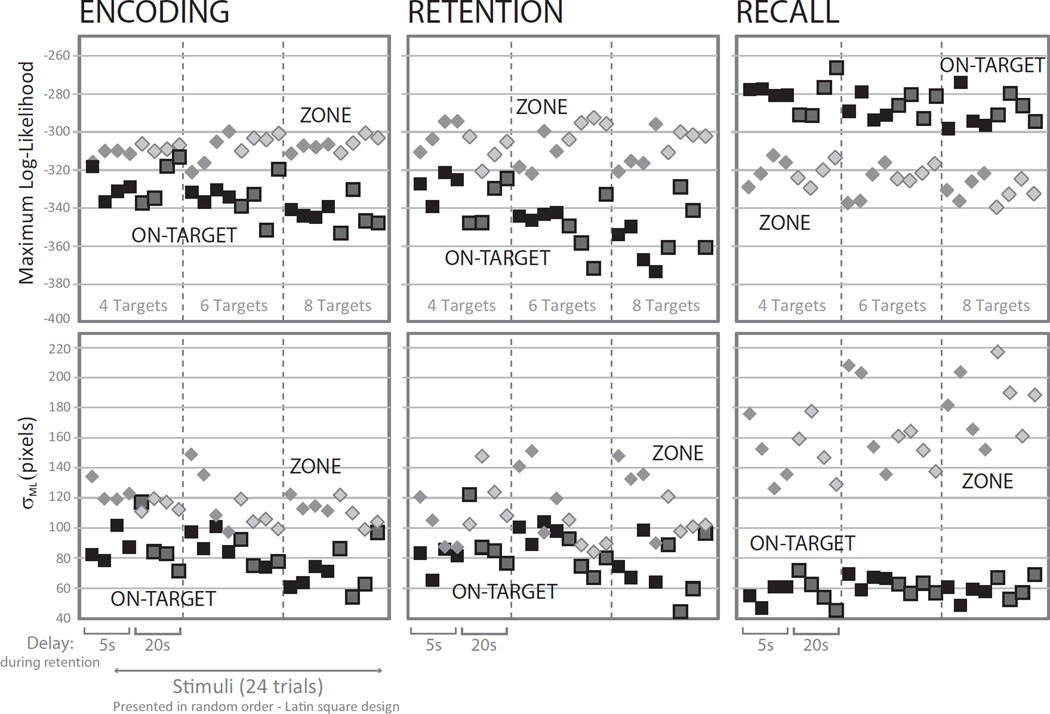
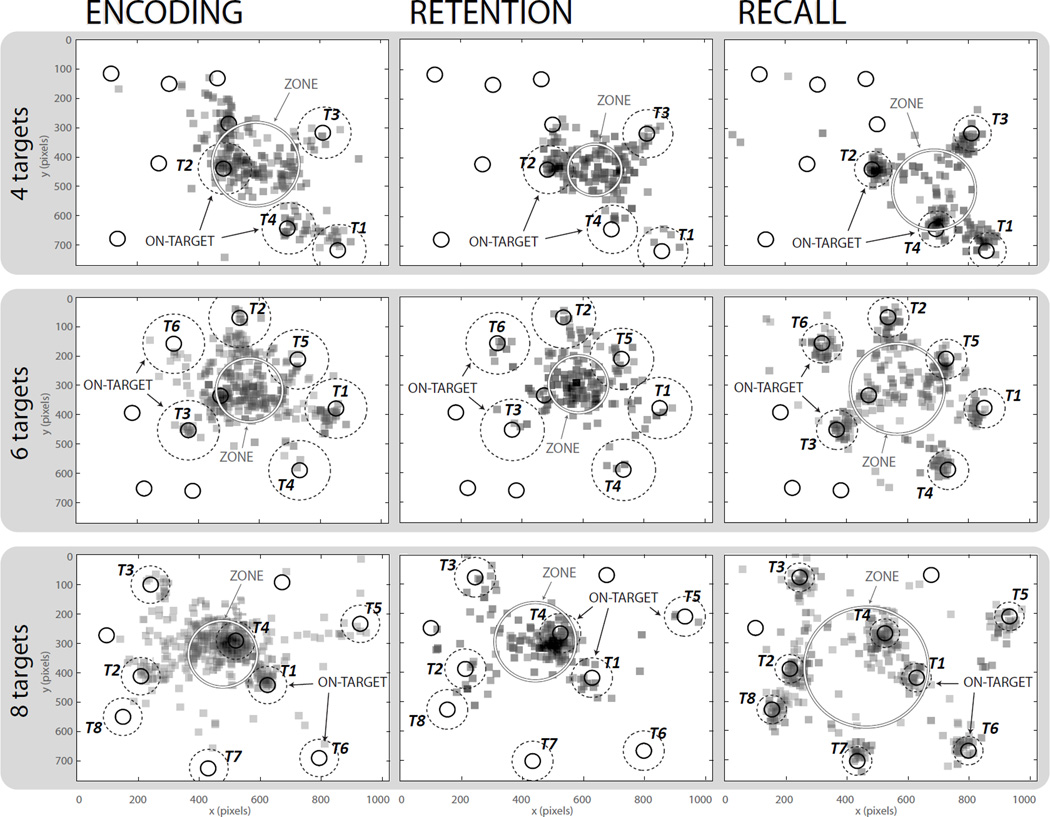
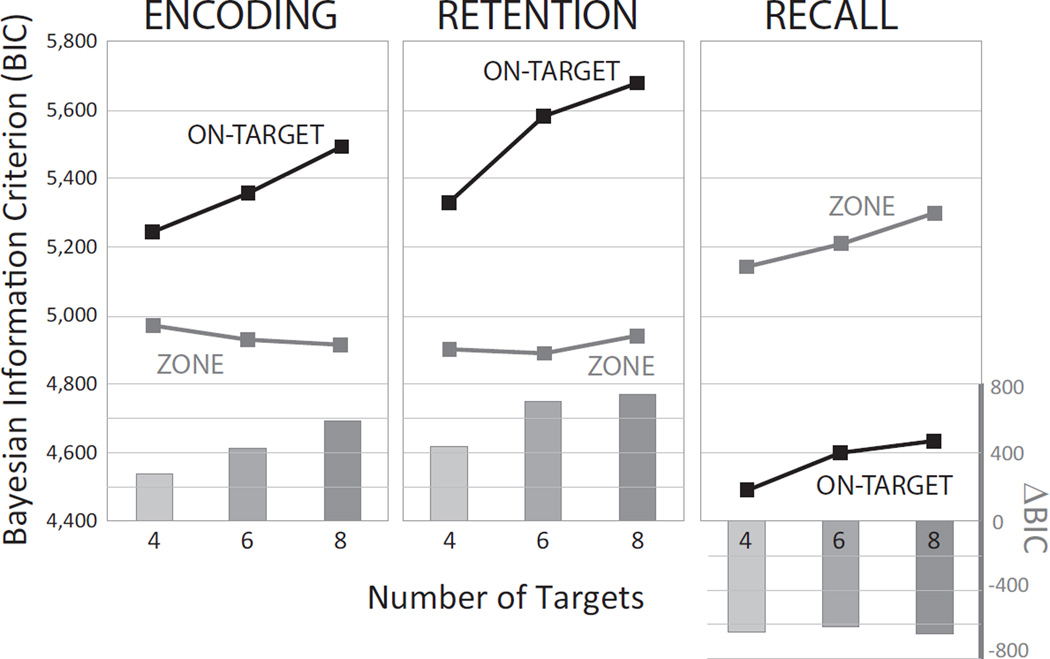
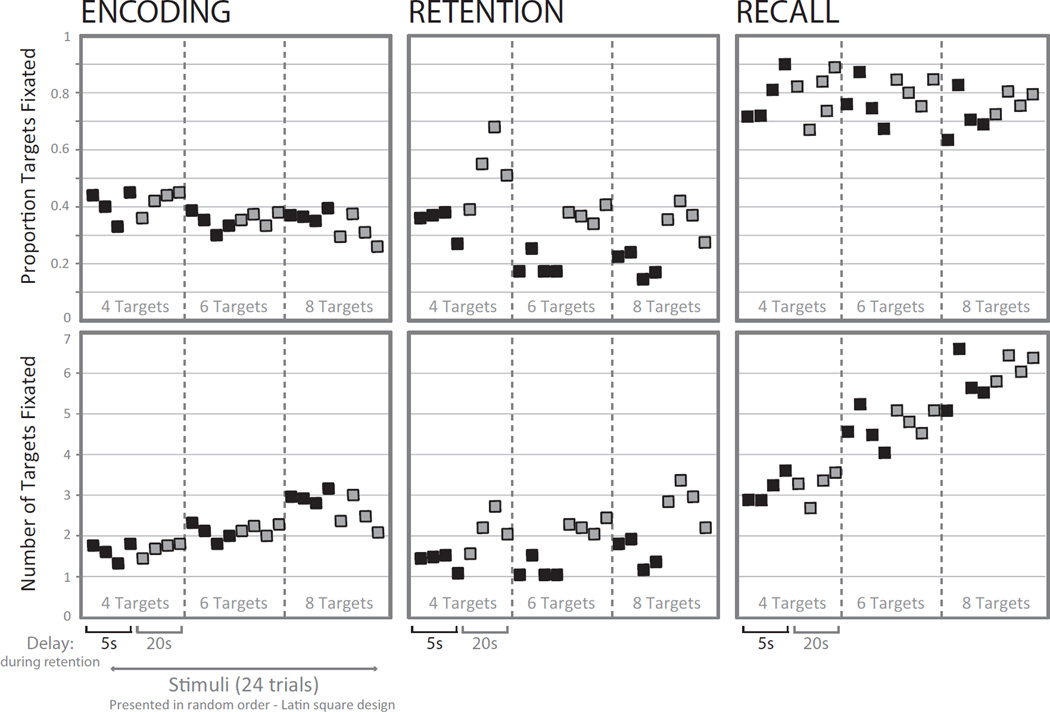
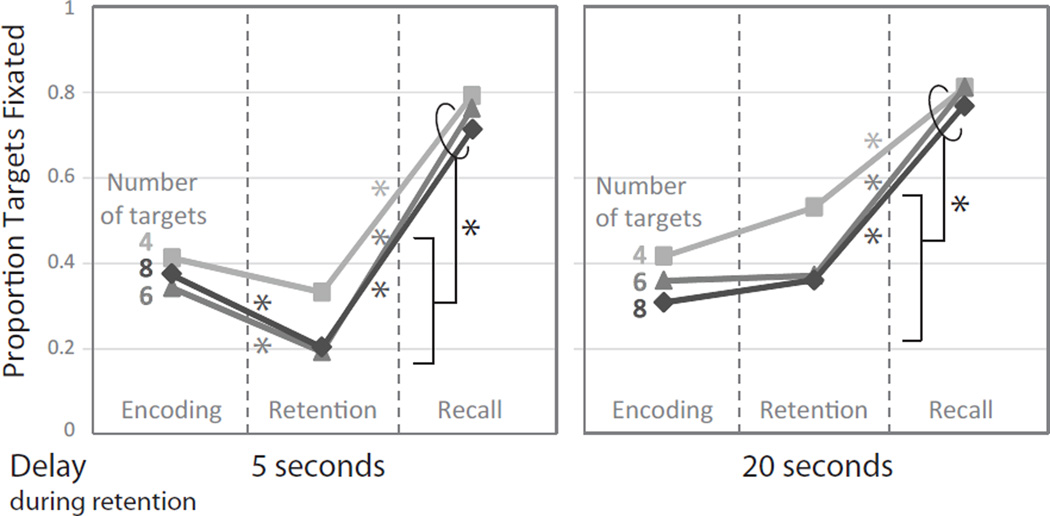
The neurocognitive processes involved during classic spatial working memory (SWM) assessment were investigated by examining naturally preferred eye movement strategies. Cognitively healthy adult volunteers were tested in a computerized version of the Corsi Block-Tapping Task--a spatial span task requiring the short term maintenance of a series of locations presented in a specific order--coupled with eye tracking. Modeling analysis was developed to characterize eye-tracking patterns across all task phases, including encoding, retention, and recall. Results revealed a natural preference for local gaze maintenance during both encoding and retention, with fewer than 40% fixated targets. These findings contrasted with the stimulus retracing pattern expected during recall as a result of task demands, with 80% fixated targets. Along with participants' self-reported strategies of mentally "making shapes," these results suggest the involvement of covert attention shifts and higher order cognitive Gestalt processes during spatial span tasks, challenging instrument validity as a single measure of SWM storage capacity.
Figures

Similar articles
-
Inter-individual variability (but intra-individual stability) of overt versus covert rehearsal strategies in a digital Corsi task.J Vis. 2024 Aug 1;24(8):2. doi: 10.1167/jov.24.8.2. J Vis. 2024. PMID: 39087936 Free PMC article.
-
Eye and hand movements during reconstruction of spatial memory.Perception. 2012;41(7):803-18. doi: 10.1068/p7216. Perception. 2012. PMID: 23155732
-
The effects of task-relevant saccadic eye movements performed during the encoding of a serial sequence on visuospatial memory performance.Exp Brain Res. 2017 May;235(5):1519-1529. doi: 10.1007/s00221-017-4915-6. Epub 2017 Mar 1. Exp Brain Res. 2017. PMID: 28251336
-
Oculomotor involvement in spatial working memory is task-specific.Cognition. 2013 Nov;129(2):439-46. doi: 10.1016/j.cognition.2013.08.006. Epub 2013 Sep 14. Cognition. 2013. PMID: 24001480
-
How workload and availability of spatial reference shape eye movement coupling in visuospatial working memory.Cognition. 2024 Aug;249:105815. doi: 10.1016/j.cognition.2024.105815. Epub 2024 May 17. Cognition. 2024. PMID: 38761645
Cited by
-
On-item fixations during serial encoding do not affect spatial working memory.Atten Percept Psychophys. 2019 Nov;81(8):2766-2787. doi: 10.3758/s13414-019-01786-5. Atten Percept Psychophys. 2019. PMID: 31254260 Free PMC article.
-
Inter-individual variability (but intra-individual stability) of overt versus covert rehearsal strategies in a digital Corsi task.J Vis. 2024 Aug 1;24(8):2. doi: 10.1167/jov.24.8.2. J Vis. 2024. PMID: 39087936 Free PMC article.
-
Dynamic resource allocation in spatial working memory during full and partial report tasks.J Vis. 2023 Feb 1;23(2):10. doi: 10.1167/jov.23.2.10. J Vis. 2023. PMID: 36802333 Free PMC article.
-
Multiple levels of mental attentional demand modulate peak saccade velocity and blink rate.Heliyon. 2022 Jan 22;8(1):e08826. doi: 10.1016/j.heliyon.2022.e08826. eCollection 2022 Jan. Heliyon. 2022. PMID: 35128110 Free PMC article.
-
Ocular measures of controlled processing: Examining the use of proactive cognitive control in the AX-CPT.Mem Cognit. 2025 Jul 21. doi: 10.3758/s13421-025-01744-7. Online ahead of print. Mem Cognit. 2025. PMID: 40691675
References
-
- Ang SY, Lee K. Central executive involvement in children’s spatial memory. Memory. 2008;16:918–933. - PubMed
-
- Awh E, Jonides J, Reuter-Lorenz PA. Rehearsal in spatial working memory. Journal of Experimental Psychology: Human Perception and Performance. 1998;24:780–790. - PubMed
-
- Awh E, Jonides J. Overlapping mechanisms of attention and spatial working memory. Trends in Cognitive Sciences. 2001;5:119–126. - PubMed
-
- Awh E, Armstrong KM, Moore T. Visual and oculomotor selection: links, causes and implications for spatial attention. Trends in Cognitive Sciences. 2006;10:124–130. - PubMed
-
- Baddeley AD, Hitch GJ. Working memory. In: Bower GH, editor. The psychology of learning and motivation: advances in research and theory. New York, NY: Academic Press; 1974. pp. 47–89.
Publication types
MeSH terms
Grants and funding
LinkOut - more resources
Full Text Sources
Other Literature Sources