

Nickel nanoparticles cause exaggerated lung and airway remodeling in mice lacking the T-box transcription factor, TBX21 (T-bet)
- PMID: 24499286
- PMCID: PMC3931667
- DOI: 10.1186/1743-8977-11-7
Nickel nanoparticles cause exaggerated lung and airway remodeling in mice lacking the T-box transcription factor, TBX21 (T-bet)
Abstract
Background: Nickel nanoparticles (NiNPs) are increasingly used in a variety of industrial applications, including the manufacturing of multi-walled carbon nanotubes (MWCNTs). While occupational nickel exposure is a known cause of pulmonary alveolitis, fibrosis, and cancer, the health risks of NiNPs are not well understood, especially in susceptible individuals such as asthmatics. The T-box transcription factor Tbx21 (T-bet) maintains Th1 cell development and loss of T-bet is associated with a shift towards Th2 type allergic airway inflammation that characterizes asthma. The purpose of this study was to determine the role of T-bet in susceptibility to lung remodeling by NiNPs or MWCNTs.
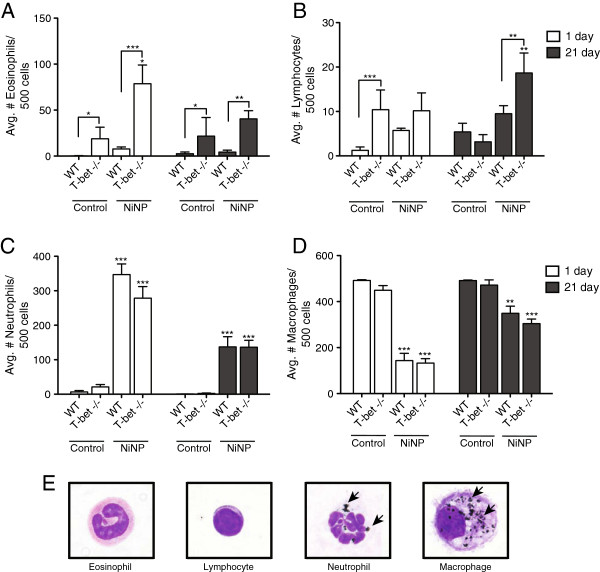
Methods: Wild-type (WT) and T-bet-/- mice were exposed to NiNPs or MWCNTs (4 mg/kg) by oropharyngeal aspiration (OPA). Necropsy was performed at 1 and 21 days. Bronchoalveolar lavage fluid (BALF) was collected for differential counting of inflammatory cells and for measurement of cytokines by ELISA. The left lung was collected for histopathology. The right lung was analyzed for cytokine or mucin (MUC5AC and MUC5B) mRNAs.
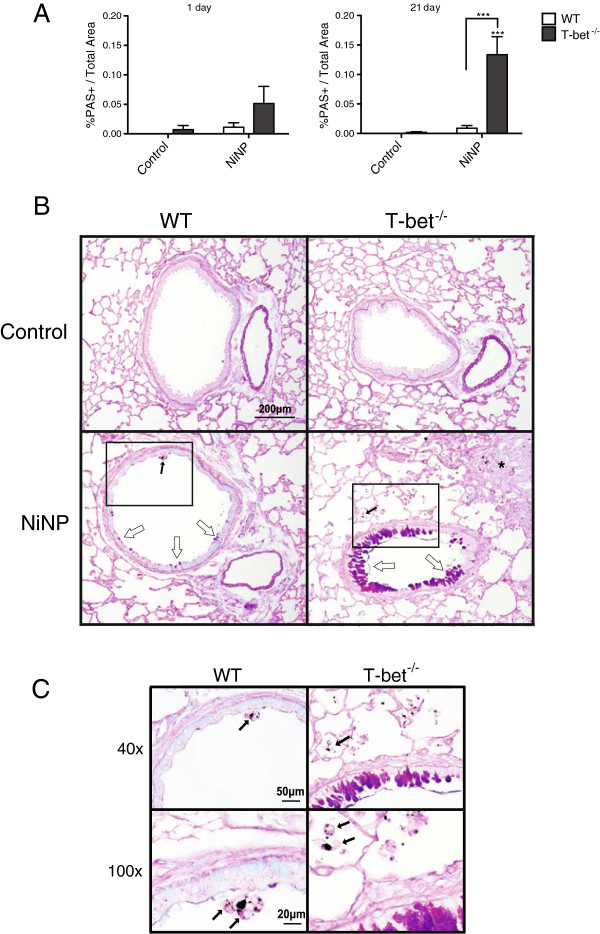
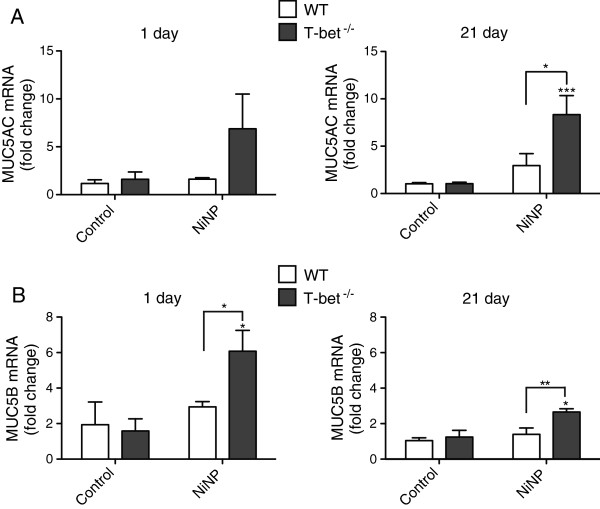
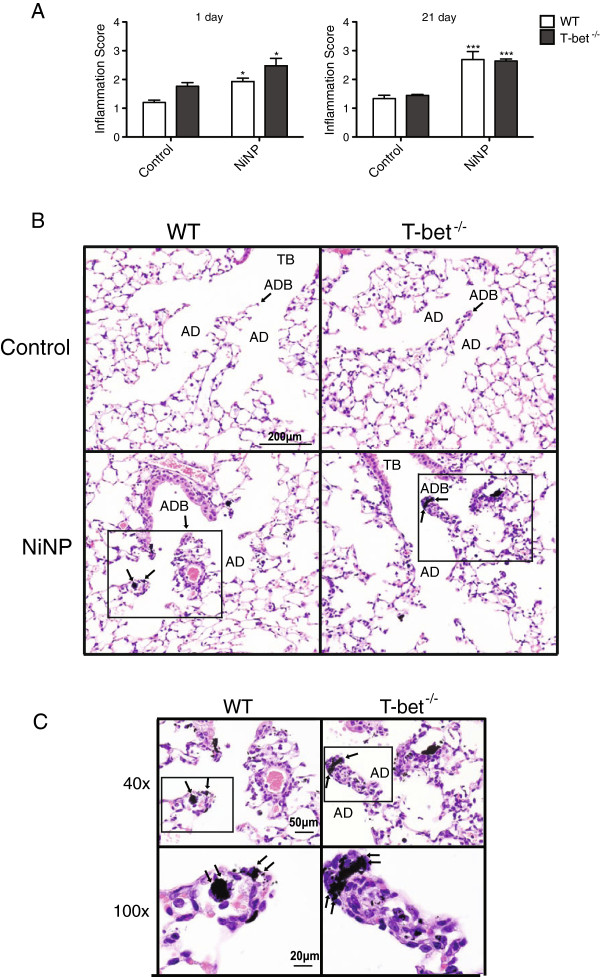
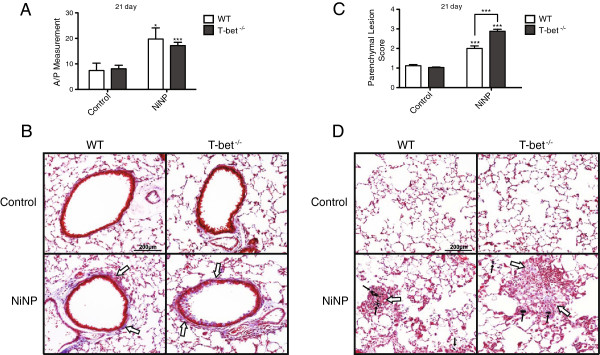
Results: Morphometry of alcian-blue/periodic acid Schiff (AB/PAS)-stained lung tissue showed that NiNPs significantly increased mucous cell metaplasia in T-bet-/- mice at 21 days (p < 0.001) compared to WT mice, and increased MUC5AC and MUC5B mRNAs (p < 0.05). MWCNTs also increased mucous cell metaplasia in T-bet-/- mice, but to a lesser extent than NiNPs. Chronic alveolitis was also increased by NiNPs, but not MWCNTs, in T-bet-/- mice compared to WT mice at 21 days (P < 0.001). NiNPs also increased IL-13 and eosinophils (p < 0.001) in BALF from T-bet-/- mice after 1 day. Interestingly, the chemokine CCL2 in the BALF of T-bet-/- mice was increased at 1 and 21 days (p < 0.001 and p < 0.05, respectively) by NiNPs, and to a lesser extent by MWCNTs at 1 day. Treatment of T-bet-/- mice with a monoclonal anti-CCL2 antibody enhanced NiNP-induced mucous cell metaplasia and MUC5AC mRNA levels (p < 0.05), yet marginally reduced NiNP-induced alveolitis.
Conclusion: These findings identify T-bet as a potentially important susceptibility factor for NiNP exposure and to a lesser extent for MWCNT exposure, and suggests that individuals with asthma are at greater risk.
Figures


Similar articles
-
Sex differences in the acute and subchronic lung inflammatory responses of mice to nickel nanoparticles.Nanotoxicology. 2020 Oct;14(8):1058-1081. doi: 10.1080/17435390.2020.1808105. Epub 2020 Aug 19. Nanotoxicology. 2020. PMID: 32813574 Free PMC article.
-
STAT1-dependent and -independent pulmonary allergic and fibrogenic responses in mice after exposure to tangled versus rod-like multi-walled carbon nanotubes.Part Fibre Toxicol. 2017 Jul 17;14(1):26. doi: 10.1186/s12989-017-0207-3. Part Fibre Toxicol. 2017. PMID: 28716119 Free PMC article.
-
Protease-activated receptor-2 (PAR2) mutation attenuates airway fibrosis in mice during the exacerbation of house dust mite‑induced allergic lung disease by multi‑walled carbon nanotubes.Respir Res. 2025 Mar 8;26(1):90. doi: 10.1186/s12931-025-03168-y. Respir Res. 2025. PMID: 40057754 Free PMC article.
-
Role of the protease-activated receptor-2 (PAR2) in the exacerbation of house dust mite-induced murine allergic lung disease by multi-walled carbon nanotubes.Part Fibre Toxicol. 2023 Aug 14;20(1):32. doi: 10.1186/s12989-023-00538-6. Part Fibre Toxicol. 2023. PMID: 37580758 Free PMC article.
-
Atomic layer deposition coating of carbon nanotubes with zinc oxide causes acute phase immune responses in human monocytes in vitro and in mice after pulmonary exposure.Part Fibre Toxicol. 2016 Jun 8;13(1):29. doi: 10.1186/s12989-016-0141-9. Part Fibre Toxicol. 2016. PMID: 27278808 Free PMC article.
Cited by
-
Synthetic Nanoparticles That Promote Tumor Necrosis Factor Receptor 2 Expressing Regulatory T Cells in the Lung and Resistance to Allergic Airways Inflammation.Front Immunol. 2017 Dec 22;8:1812. doi: 10.3389/fimmu.2017.01812. eCollection 2017. Front Immunol. 2017. PMID: 29312323 Free PMC article.
-
The Toxicology of Engineered Nanomaterials in Asthma.Curr Environ Health Rep. 2018 Mar;5(1):100-109. doi: 10.1007/s40572-018-0181-4. Curr Environ Health Rep. 2018. PMID: 29441464 Free PMC article. Review.
-
Metal nanomaterials: Immune effects and implications of physicochemical properties on sensitization, elicitation, and exacerbation of allergic disease.J Immunotoxicol. 2019 Dec;16(1):87-124. doi: 10.1080/1547691X.2019.1605553. J Immunotoxicol. 2019. PMID: 31195861 Free PMC article. Review.
-
Nickel oxide nanoparticles exposure as a risk factor for male infertility: "In vitro" effects on porcine pre-pubertal Sertoli cells.Front Endocrinol (Lausanne). 2023 Mar 30;14:1063916. doi: 10.3389/fendo.2023.1063916. eCollection 2023. Front Endocrinol (Lausanne). 2023. PMID: 37065743 Free PMC article.
-
Role of Macrophages in Air Pollution Exposure Related Asthma.Int J Mol Sci. 2022 Oct 15;23(20):12337. doi: 10.3390/ijms232012337. Int J Mol Sci. 2022. PMID: 36293195 Free PMC article. Review.
References
-
- Centers for Disease Control and Prevention (CDC) Vital signs: asthma prevalence, disease characteristics, and self-management education: United States, 2001--2009. MMWR Morb Mortal Wkly Rep. 2011;60:547–552. - PubMed
Publication types
MeSH terms
Substances
Grants and funding
LinkOut - more resources
Full Text Sources
Other Literature Sources
Medical
