. 2014:5:3262.
doi: 10.1038/ncomms4262.

Optogenetic astrocyte activation modulates response selectivity of visual cortex neurons in vivo

Affiliations
Free PMC article

Optogenetic astrocyte activation modulates response selectivity of visual cortex neurons in vivo

Gertrudis Perea et al. Nat Commun. 2014.
Free PMC article

Abstract

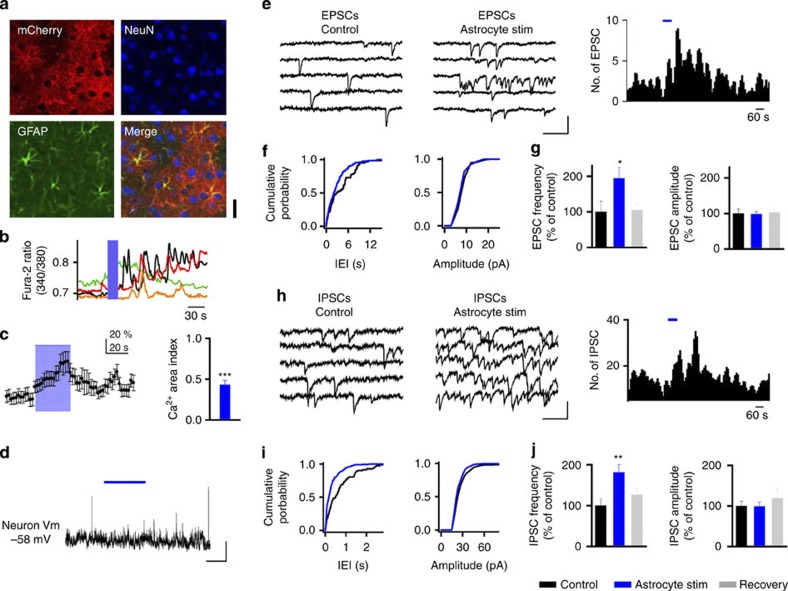
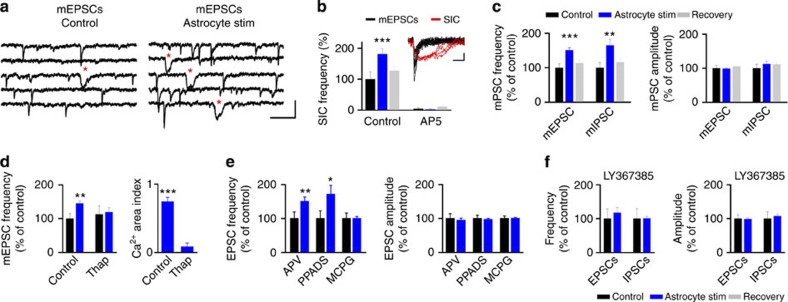
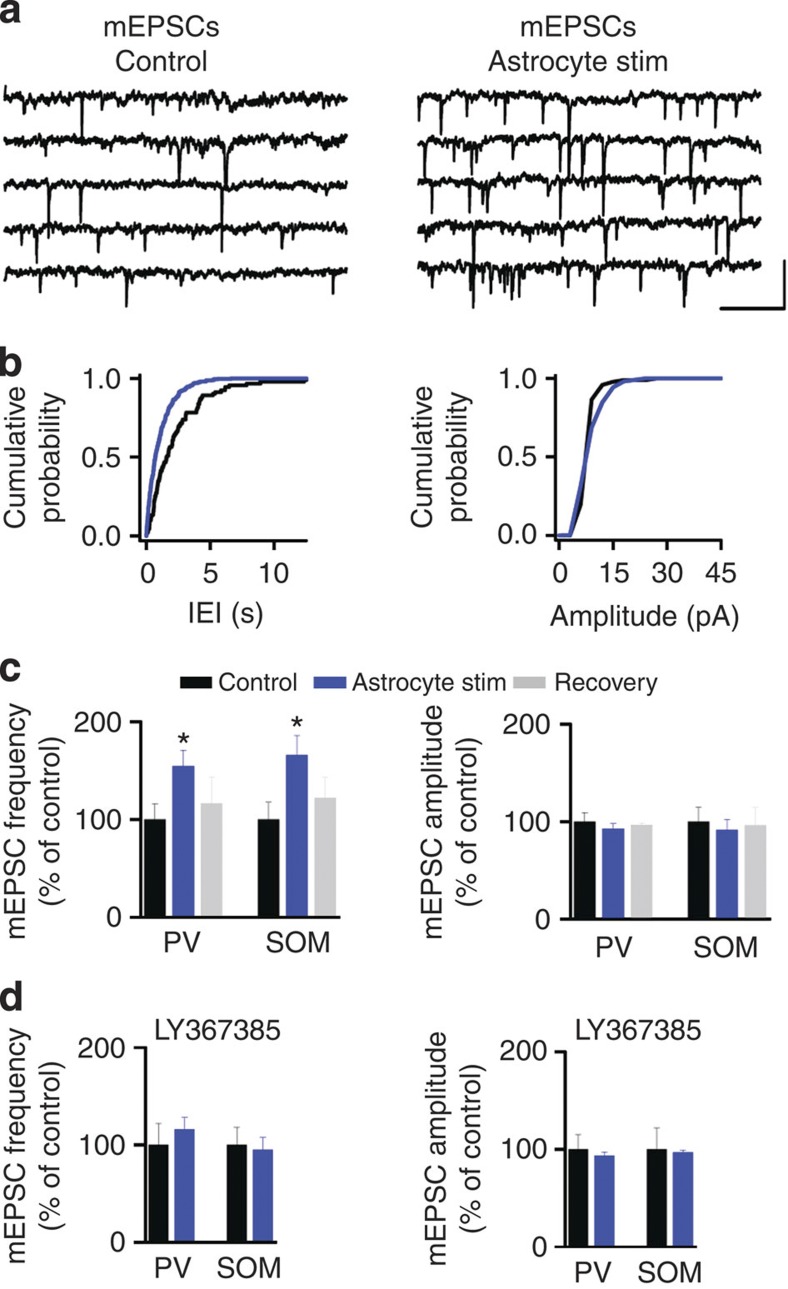
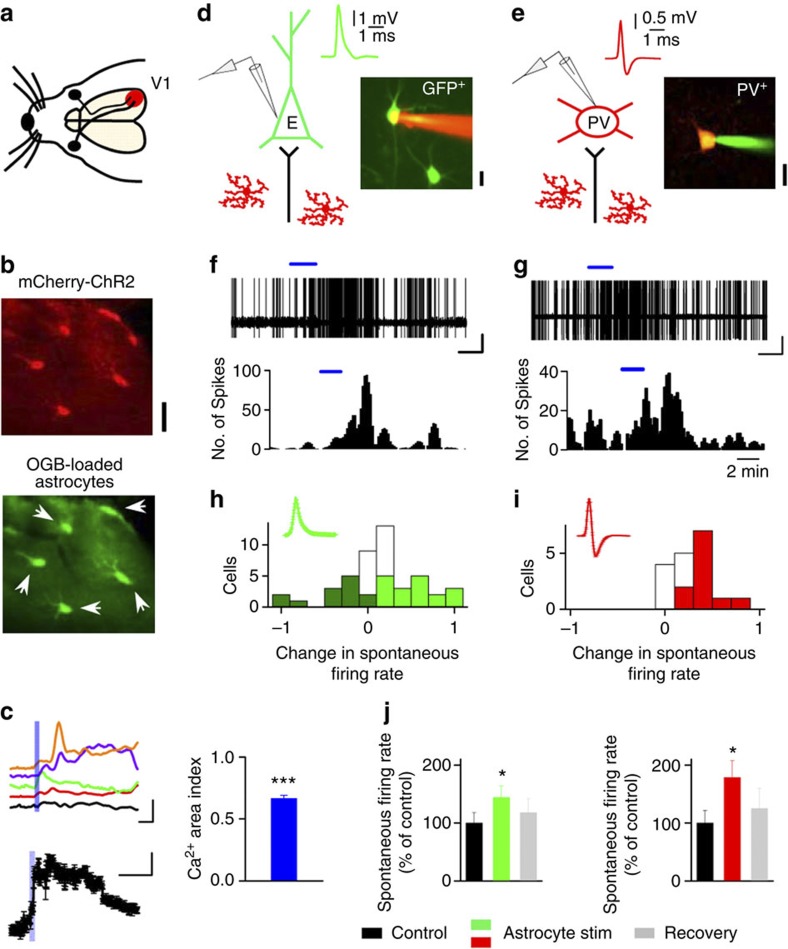
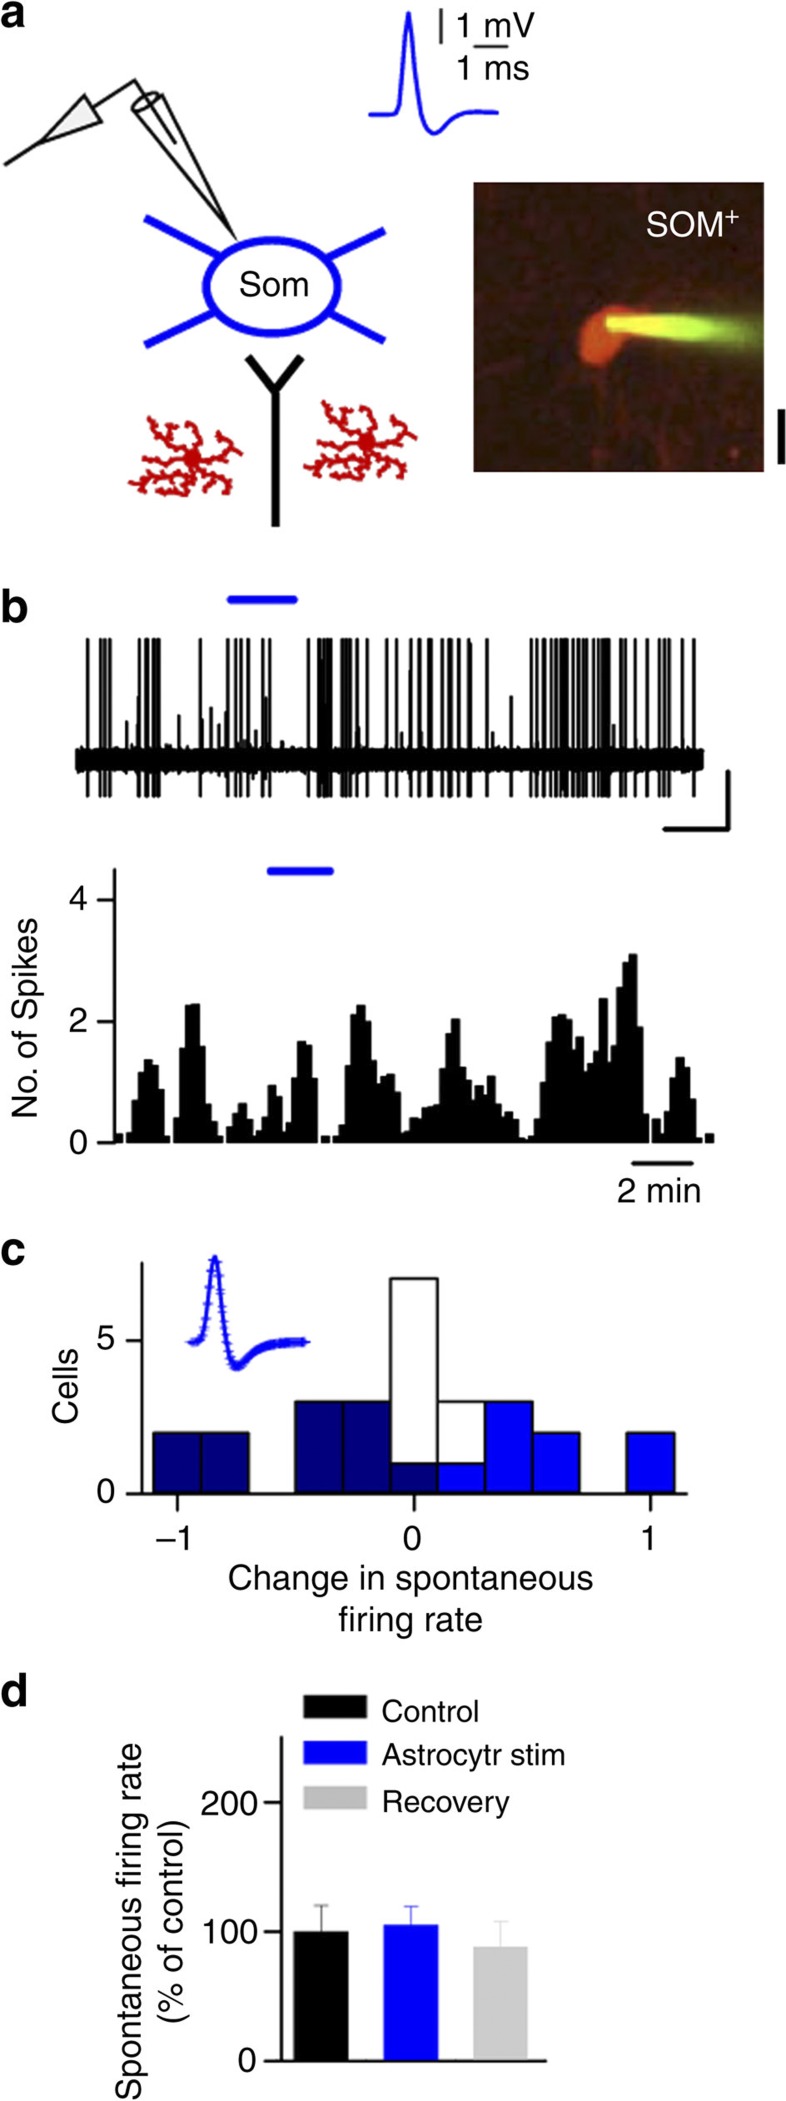
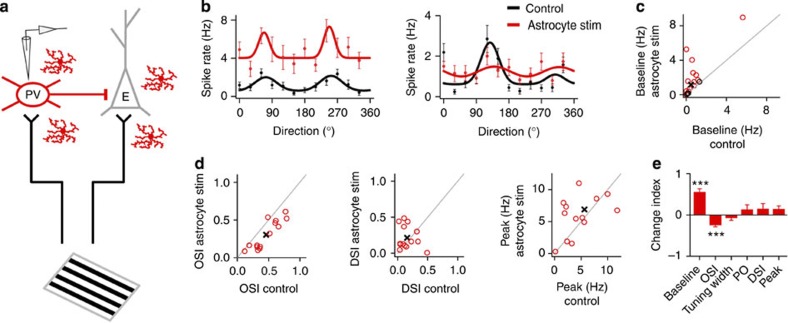
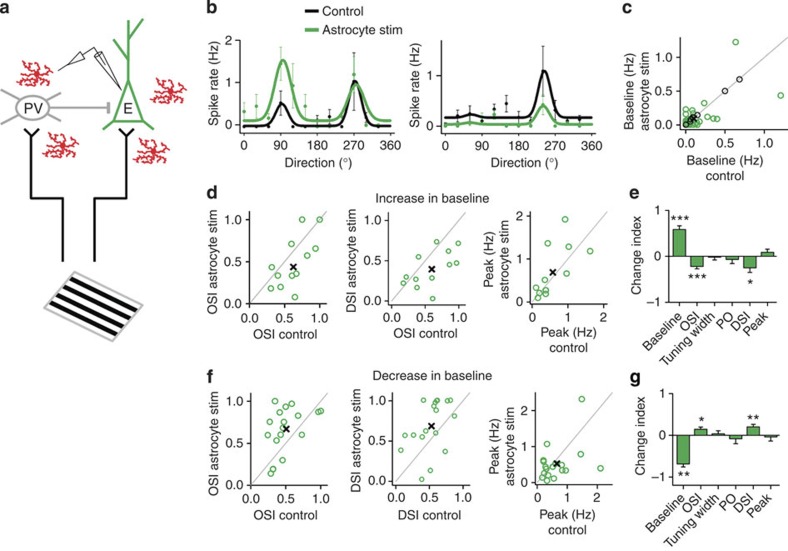
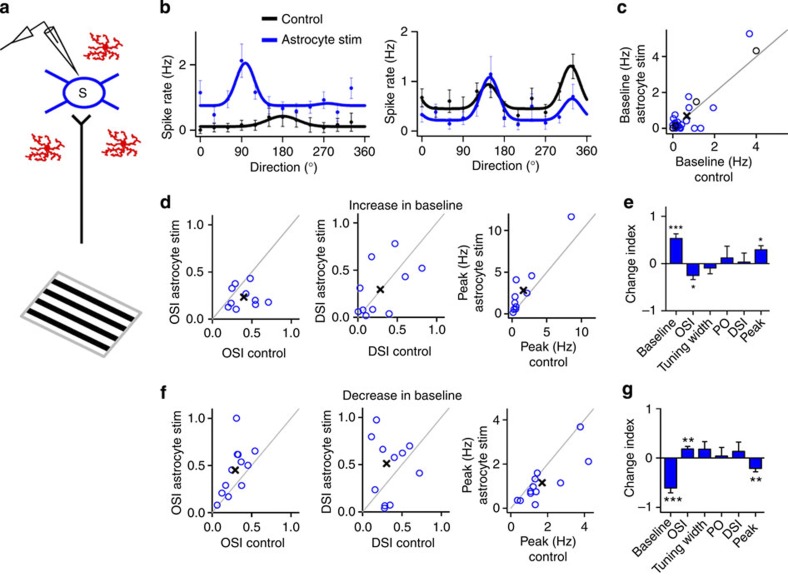
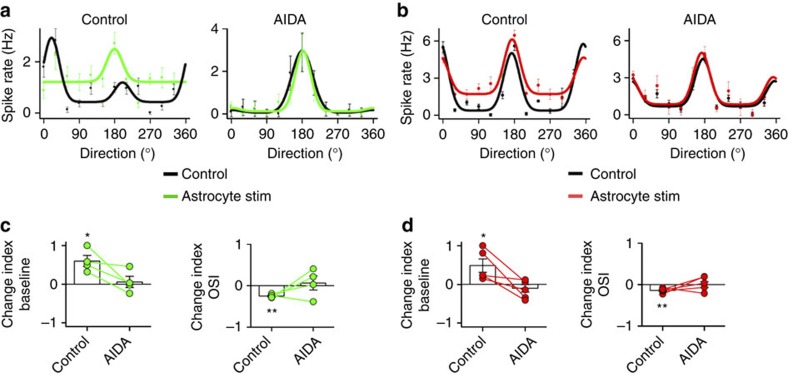
Astrocytes play important roles in synaptic transmission and plasticity. Despite in vitro evidence, their causal contribution to cortical network activity and sensory information processing in vivo remains unresolved. Here we report that selective photostimulation of astrocytes with channelrhodopsin-2 in primary visual cortex enhances both excitatory and inhibitory synaptic transmission, through the activation of type 1a metabotropic glutamate receptors. Photostimulation of astrocytes in vivo increases the spontaneous firing of parvalbumin-positive (PV(+)) inhibitory neurons, while excitatory and somatostatin-positive (SOM(+)) neurons show either an increase or decrease in their activity. Moreover, PV(+) neurons show increased baseline visual responses and reduced orientation selectivity to visual stimuli, whereas excitatory and SOM(+) neurons show either increased or decreased baseline visual responses together with complementary changes in orientation selectivity. Therefore, astrocyte activation, through the dual control of excitatory and inhibitory drive, influences neuronal integrative features critical for sensory information processing.


Figures

Figure 1
Figure 1. Selective stimulation of ChR2-transfected astrocytes induces enhancement of synaptic transmission in layer 2/3 of V1.
(a) Immunocytochemical localization of ChR2–mCherry, NeuN and GFAP in V1 cortical slices. Note the selective expression of ChR2–mCherry in astrocytes (bottom). Scale bar, 15 μm. (b) Astrocyte Ca2+signals evoked by ChR2 stimulation (20 Hz, 20 s; blue bar). (c) Population astrocyte Ca2+ signal versus time evoked by ChR2 stimulation (20 Hz, 30 s; blue bar) and Ca2+ area index (n=59 astrocytes from 7 slices from three mice). ***P<0.001; Wilcoxon Test. (d) Representative neuron membrane potential recording during astrocyte photostimulation (20 Hz, 60 s; blue horizontal bar). Scale bar, 4 mV, 30 s. (e,h) Representative recordings from 2/3 layer neurons of spontaneous excitatory currents (EPSCs, e) and IPSCs (h) before (Control) and after astrocyte stimulation. Scale bar, 10 pA, 200 ms for EPSCs; 40 pA, 200 ms for IPSCs. Right, histogram of number of EPSCs and IPSCs versus time (bin width 10 s) before and after astrocyte stimulation (20 Hz, 60 s; blue horizontal bar). (f,i) Cumulative probability plots for inter-event interval (bin width 20 ms) and synaptic current amplitude (bin width 3pA) before and after astrocyte stimulation (black and blue traces, respectively) from neurons shown in e,h. (g,j) Relative changes in EPSC and IPSC frequency and amplitude in control, during astrocyte stimulation and 10-min post stimulation (recovery) (EPSCs, n=9 neurons; IPSCs, n=10 neurons). *P<0.05, **P<0.01; Two-tailed Student’s t-test. Error bars indicate s.e.m.
Figure 2
Figure 2. Astrocyte-induced enhancement of synaptic transmission is mediated by mGluR activation.
(a) Whole-cell recordings from 2/3 layer neurons of mEPSCs and SICs (red asterisks), showing an increase in frequency of mEPSC and SICs after astrocyte optogenetic stimulation. Scale bar, 15pA, 200 ms. (b) Relative changes of SIC frequency before (control; black), during astrocyte stimulation (blue) and after stimulation (recovery; grey) before and after perfusion of AP5 (50 μM; n=5). Inset right, representative traces of mEPSCs (black traces) and SICs (red traces) from neuron shown in a. Scale bar, 5pA, 20 ms. (c) Relative changes of mEPSC (n=15) and mIPSC (n=8) frequency and amplitude before (Control), during astrocyte stimulation, and 10-min post stimulation (recovery). (d) Relative changes of mEPSC frequency before (control) and after astrocyte stimulation in the presence of thapsigargin (1 μM; n=6). **P<0.01; two-tailed Student t-test. Ca2+ area index following ChR2 stimulation before and after thapsigargin (n=32 astrocytes from four slices from two mice). ***P<0.001; Wilcoxon test. (e) Relative changes of spontaneous EPSC frequency and amplitude before (control) and after astrocyte stimulation in the presence of AP5 (50 μM; n=10), PPADS (30 μM; n=7) and MCPG (0.8 mM; n=13), respectively. (f) Relative changes of spontaneous EPSC (n=9) and IPSC (n=7) frequency and amplitude evoked by astrocyte stimulation in the presence of LY367385 (100 μM). *P<0.05, **P<0.01, ***P<0.001; two-tailed Student’s t-test. Error bars indicate s.e.m.
Figure 3
Figure 3. Selective stimulation of ChR2-transfected astrocytes induces enhancement of miniature excitatory synaptic transmission in PV+ and SOM+ neurons.
(a) Representative recordings from PV+ neurons of mEPSCs before (Control) and after astrocyte stimulation. Scale bar, 15 pA, 200 ms. (b) Cumulative probability plots for inter-event interval (bin width 20 ms) and synaptic current amplitude (bin width 3 pA) before and after astrocyte stimulation (black and blue traces, respectively) from neuron shown in a. (c) Relative changes in mEPSC frequency and amplitude in control, during astrocyte stimulation and 10-min post stimulation (recovery) for PV+ neurons (n=9) and SOM+ neurons (n=5). (d) Relative changes of mEPSC frequency and amplitude evoked by astrocyte stimulation in the presence of LY367385 (100 μM; PV+ neurons, n=7; SOM+ neurons, n=5). *P<0.05; two-tailed Student’s t-test. Error bars indicate s.e.m.
Figure 4
Figure 4. Astrocytes modulate spontaneous activity of PV+ and excitatory visual cortex neurons in vivo.
(a) Schematic illustration of the visual pathway in mice, and in vivo ChR2–mCherry expression in V1 for calcium imaging and electrophysiological recordings. (b) Representative fluorescence images of ChR2–mCherry-expressing astrocytes bulk-loaded with OGB (arrows). Scale bar, 40 μm. (c) Up, representative astrocyte Ca2+signals evoked by ChR2 stimulation (5 Hz, 20 s; blue bar). Scale bar, 40%, 60 s. Down, population astrocyte Ca2+ signals versus time and Ca2+ area index after ChR2 stimulation (n=33 astrocytes from three mice). ***P<0.001; Wilcoxon test. Scale bar, 8%, 120 s. (d,e) Schematic drawing of targeted cell-attached recordings from GFP+ excitatory neurons, and tdTomato-PV+ neurons in vivo, and the corresponding spike waveforms and fluorescence images. Astrocytes are depicted in red. Scale bars, 40 μm. (f,g) Cell-attached recordings showing the increase in spontaneous firing rate after astrocyte photostimulation. Bottom, corresponding histograms of number of spikes (bin width 10 s) versus time of the excitatory cell and PV+ neuron (20 Hz, 2 min; blue bar) recorded in d,e, respectively. Scale bars, 1 mV, 60 s. (h,i) Histograms of firing rate changes after astrocyte stimulation for GFP+ excitatory cells (n=45 from 25 mice, green) and PV+ neurons (n=18 from 12 mice, red). Inset, normalized mean population spike waveform. Dark green, light green/red and white bars denote cells with a decrease, increase and no significant change in firing rate, respectively. (j) Relative changes of spontaneous firing rate before (control), after astrocyte stimulation and 10-min post stimulation (recovery). *P<0.05; two-tailed Student’s t-test. Error bars indicate s.e.m.
Figure 5
Figure 5. Astrocytes induce changes in spontaneous activity of SOM+ neurons in vivo.
(a) Schematic drawing of targeted cell-attached recordings in SOM+ interneuron in vivo, and the corresponding spike waveform and fluorescence image. Astrocytes are labelled in red. Scale bar, 40 μm. (b) Spontaneous activity of cell-attached recordings in a showing no changes in the spontaneous firing rate after photostimulation of astrocytes (20 Hz for 2 min; blue bar). Bottom, corresponding histogram of number of spikes (bin width 10 s) versus time. Scale bar, 0.5 mV, 2 min. (c) Histogram of firing rate changes after astrocyte stimulation for SOM+ neurons (n=27 from 14 mice). Dark blue, light blue and white bars denote cells with a decrease (n=11), increase (n=8) and no significant changes in firing rate (n=8), respectively. Inset, normalized mean population spike waveform. (d) Relative changes of spontaneous firing rate before (control), after astrocyte stimulation and 10-min post stimulation (recovery) (n=27). Error bars indicate s.e.m.
Figure 6
Figure 6. Astrocytes induce changes in visual response properties of PV+ neurons in vivo.
(a) Schematic drawings of cell-attached recordings from PV+ neuron, visual stimulation, putative intracortical connectivity and ChR2-transfected astrocytes. (b) Representative tuning curves of two PV+ neurons before (Control, black) and after astrocyte stimulation (red). Tuning curves are best-fit Gaussians to the mean firing rates (dots denote measured firing rates and lines denote fitted curves; error bars denote s.e.m. of 10 responses). (c) Population summary of astrocyte-induced changes in baseline firing rate (circles denote individual cells, n=18. Black circles, cells with no significant changes that were discarded from subsequent analyses, n=4. Cross denotes population average). (d) Population summary of astrocyte-induced changes in OSI, DSI and peak firing rate (n=14). (e) Index (normalized change) in tuning properties after versus before astrocyte stimulation. ***P<0.001; Wilcoxon test. Error bars indicate s.e.m.
Figure 7
Figure 7. Astrocytes drive changes in visual response properties of excitatory neurons in vivo.
(a) Schematic drawings of cell-attached recordings from excitatory neuron, visual stimulation, putative intracortical connectivity and ChR2-transfected astrocytes. (b) Representative tuning curves of two excitatory neurons before (Control, black) and after astrocyte stimulation (green). (c) Population summary of astrocyte-induced changes in baseline firing rate (circles denote individual cells, n=45. Black circles, cells with no significant changes that were discarded from subsequent analyses, n=9). (d,f) Population summary of astrocyte-induced changes in OSI, DSI and peak firing rate of cells with an increase (d; n=16) or decrease (f; n=20) in baseline. (e,g) Index (normalized change) in tuning properties after versus before astrocyte stimulation for cells with an increase (e; n=16) or decrease (g; n=20) in baseline. *P<0.05, **P<0.01, ***P<0.001; Wilcoxon test. Error bars indicate s.e.m.
Figure 8
Figure 8. Astrocytes induce changes in visual response properties of SOM+ neurons in vivo.
(a) Schematic drawing of targeted cell-attached recordings in SOM+ interneuron, visual stimulation and ChR2-transfected astrocytes. (b) Representative tuning curves of two SOM+ neurons before (Control, black) and after astrocyte stimulation (blue). Dots denote measured firing rates and lines denote fitted curves (error bars denote s.e.m. of 10 responses). (c) Population summary of astrocyte-induced changes in baseline firing rate (circle, individual cell; n=27 from 14 mice. Black circles, cells with no significant changes, n=5. Cross, population average). (d,f) Population summary of astrocyte-induced changes in OSI, DSI and peak firing rate from cells that displayed an increase (d; n=10) or decrease (f; n=12) in baseline firing rate. (e,g) Index (normalized change) in tuning properties after versus before astrocyte stimulation for cells with an increase (e; n=10) or decrease (g; n=12) in baseline. *P<0.05; **P<0.01; ***P<0.001; Wilcoxon test. Error bars indicate s.e.m.
Figure 9
Figure 9. Astrocyte-induced changes of visual features in cortical neurons are mediated by mGluR1a activation.
(a) Tuning curves of an excitatory neuron before (Control, black) and after astrocyte stimulation (green), in control and 30 min after intraperitoneal injection of AIDA (5 mg kg−1). Dots denote measured firing rates and lines denote fitted curves (n=10 responses). (b). Tuning curves of a PV+ neuron before (Control, black) and after astrocyte stimulation (red), in control and after AIDA injection. (c) Summary of astrocyte-induced changes in baseline firing rate and OSI in excitatory cells (circle, individual cell. Bars, average data; n=4 from four mice) (d) Summary of astrocyte-induced changes in baseline firing rate and OSI in PV+ neurons (circle, individual cell. Bars, average data; n=5 from five mice). The changes observed after astrocyte stimulation were abolished in the presence of mGluR1a antagonist, AIDA. *P<0.05; **P<0.01; Wilcoxon test. Error bars indicate s.e.m.

References

    1. Eroglu C. & Barres B. A. Regulation of synaptic connectivity by glia. Nature 468, 223–231 (2010). - PMC - PubMed
    1. Perea G., Navarrete M. & Araque A. Tripartite synapses: astrocytes process and control synaptic information. Trends Neurosci. 32, 421–431 (2009). - PubMed
    1. Di Castro M. A. et al.. Local Ca2+ detection and modulation of synaptic release by astrocytes. Nat. Neurosci. 14, 1276–1284 (2011). - PubMed
    1. Henneberger C., Papouin T., Oliet S. H. & Rusakov D. A. Long-term potentiation depends on release of D-serine from astrocytes. Nature 463, 232–236 (2010). - PMC - PubMed
    1. Panatier A. et al.. Glia-derived D-serine controls NMDA receptor activity and synaptic memory. Cell 125, 775–784 (2006). - PubMed

Publication types