. 2014 Apr 4;289(14):9833-43.
doi: 10.1074/jbc.M113.530659. Epub 2014 Feb 5.

Phosphatidylinositol 4,5-bisphosphate alters the number of attachment sites between ezrin and actin filaments: a colloidal probe study

Affiliations

Phosphatidylinositol 4,5-bisphosphate alters the number of attachment sites between ezrin and actin filaments: a colloidal probe study

Julia A Braunger et al. J Biol Chem. .

Abstract

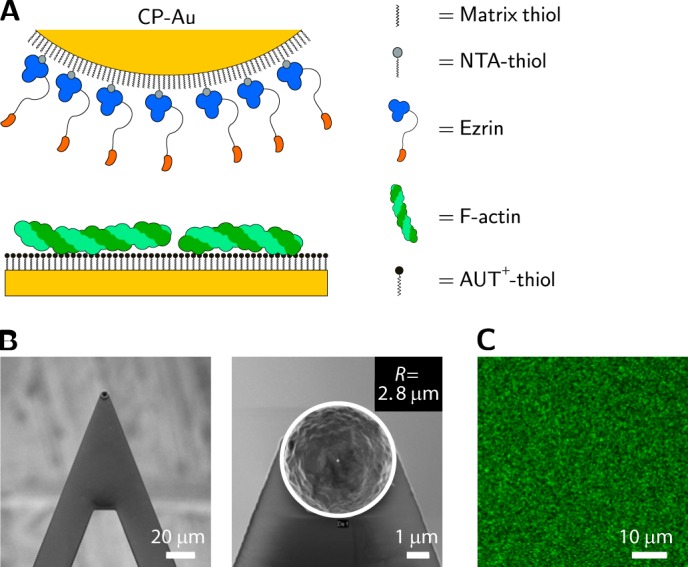
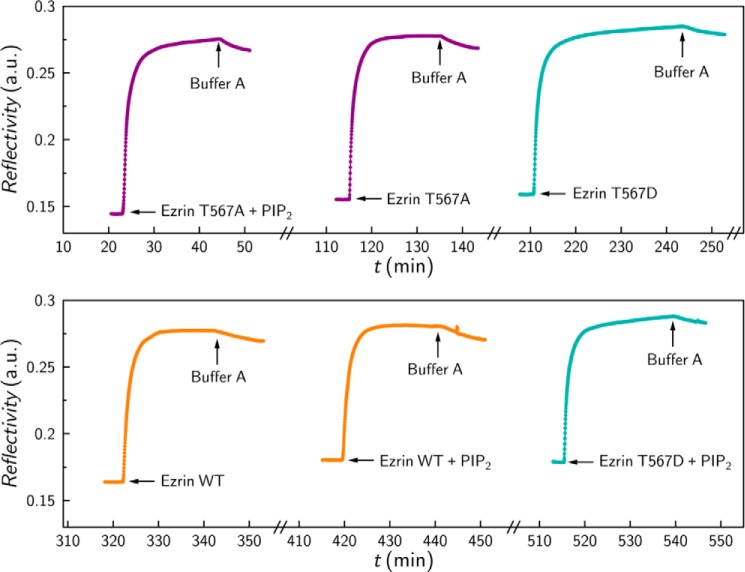
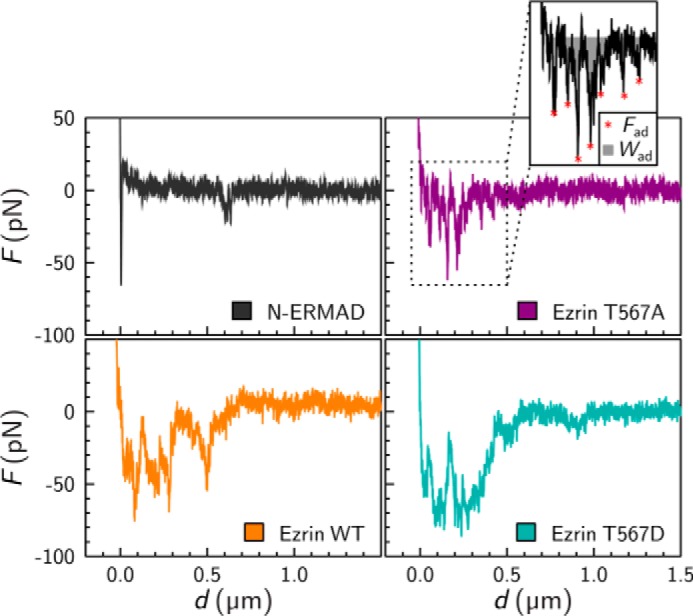
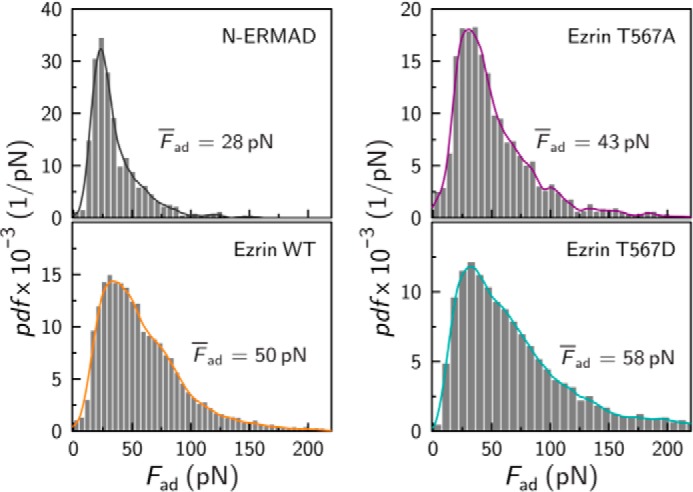
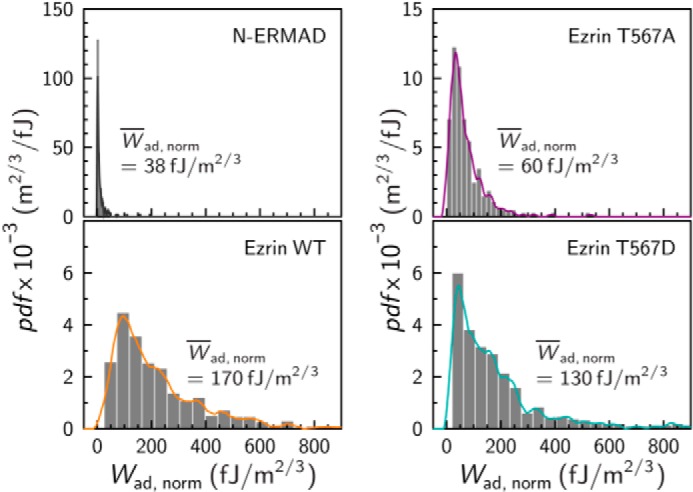
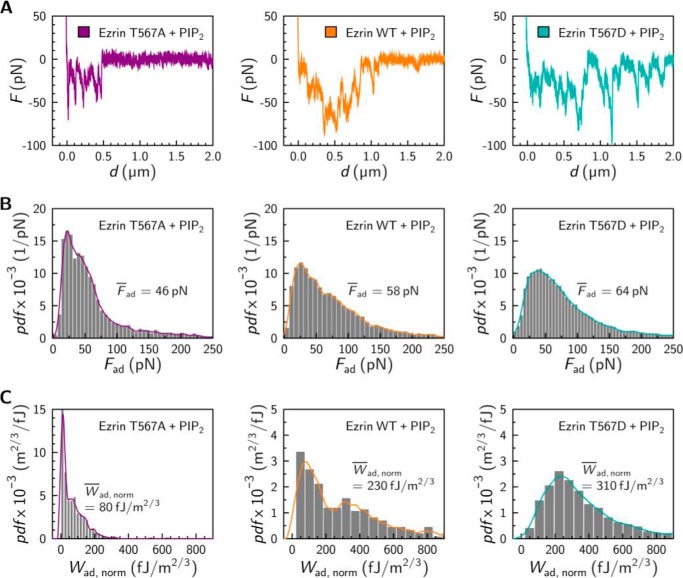
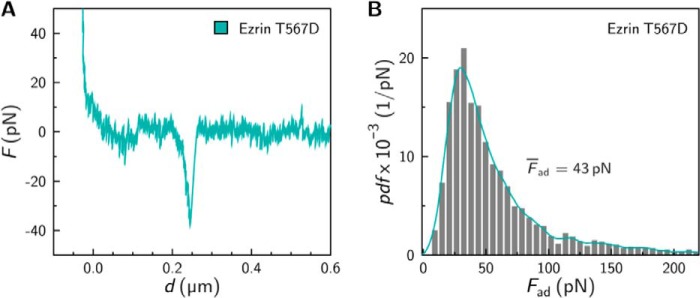
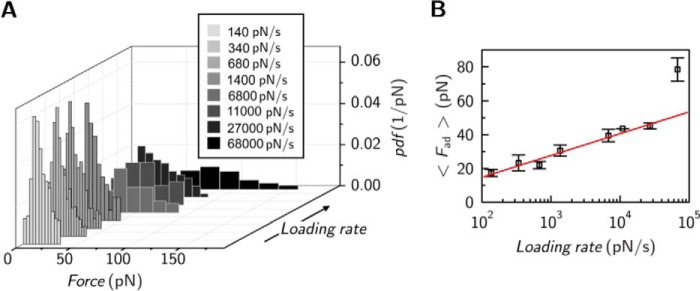
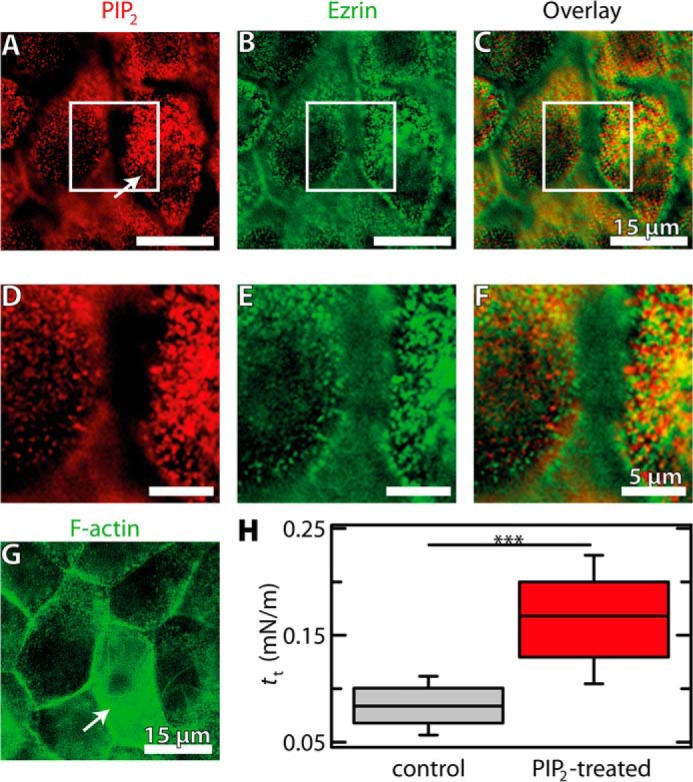
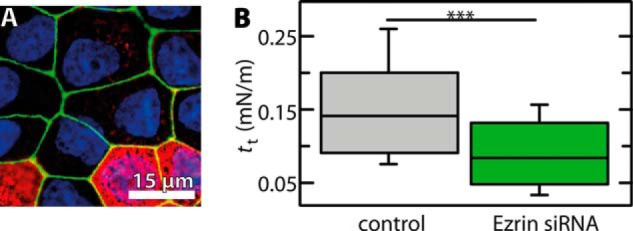
Direct linkage between the plasma membrane and the actin cytoskeleton is controlled by the protein ezrin, a member of the ezrin-radixin-moesin protein family. To function as a membrane-cytoskeleton linker, ezrin needs to be activated in a process that involves binding of ezrin to phosphatidylinositol 4,5-bisphosphate (PIP2) and phosphorylation of a conserved threonine residue. Here, we used colloidal probe microscopy to quantitatively analyze the interaction between ezrin and F-actin as a function of these activating factors. We show that the measured individual unbinding forces between ezrin and F-actin are independent of the activating parameters, in the range of approximately 50 piconewtons. However, the cumulative adhesion energy greatly increases in the presence of PIP2 demonstrating that a larger number of bonds between ezrin and F-actin has formed. In contrast, the phosphorylation state, represented by phosphor-mimetic mutants of ezrin, only plays a minor role in the activation process. These results are in line with in vivo experiments demonstrating that an increase in PIP2 concentration recruits more ezrin to the apical plasma membrane of polarized cells and significantly increases the membrane tension serving as a measure of the adhesion sites between the plasma membrane and the F-actin network.

Keywords: Actin; Atomic Force Microscopy; Ezrin; Phosphatidylinositol; Phosphorylation.


Figures

FIGURE 1.
FIGURE 1.
Setup for colloidal probe measurements. A, schematic drawing of a gold colloidal probe (CP-Au) coated with ezrin via His6 tag attachment to a NTA-thiol containing self-assembled monolayer. F-actin is immobilized on a positively charged AUT+ monolayer on a gold-coated silicon wafer. B, scanning electron micrographs of the cantilever (left) and the colloidal probe (right). C, confocal fluorescence image of Alexa Fluor 488-phalloidin-labeled F-actin bound to an AUT+ monolayer.
FIGURE 2.
FIGURE 2.
Time-resolved adsorption of His6-tagged protein (1 μm) to NTA-thiol containing self-assembled monolayer monitored by surface plasmon resonance measurements. When indicated, the protein was preincubated in equimolar PIP2 solution. The x axis breaks correspond to imidazole induced elution of bound protein to regenerate the sensor surface as the entire measurement was performed on one chip.
FIGURE 3.
FIGURE 3.
Force retraction curves obtained from a protein-coated colloidal probe and an F-actin-covered surface. Retraction velocity was 1 μm/s. For data analysis, the unbinding force peaks (red stars) and the area under the curve (gray area) were evaluated, yielding adhesion forces (Fad) and surface adhesion energies (Wad) as shown for ezrin T567A (inset).
FIGURE 4.
FIGURE 4.
Probability density function (pdf) of adhesion forces Fad between an F-actin surface and an ezrin-covered probe. Histogram analysis (gray bars) and kernel density estimation (solid lines) for N-ERMAD (gray, n = 564, n = 3 experiments), ezrin T567A (purple, n = 2,825, n = 2 experiments), ezrin WT (orange, n = 6,128, n = 4 experiments), and ezrin T567D (dark cyan, n = 4,747, n = 4 experiments). Median values Fad are given.
FIGURE 5.
FIGURE 5.
Probability density function (pdf) of normalized cumulative surface adhesion energies Wad, norm between an F-actin surface and ezrin-covered probe. Histogram analysis (gray bars) and kernel density estimation (solid lines) N-ERMAD (gray, n = 156, n = 3 experiments), ezrin T567A (purple, n = 236, n = 2 experiments), ezrin WT (orange, n = 519, n = 4 experiments), and ezrin T567D (dark cyan, n = 505, n = 4 experiments). Median values Wad,norm are given.
FIGURE 6.
FIGURE 6.
Influence of PIP2 on the interaction between an ezrin coated colloidal probe and an F-actin covered surface. A, typical force retraction curves. B, probability density function (pdf) of normalized adhesion forces Fad (ezrin T567A, n = 3849, n = 4 experiments; ezrin WT, n = 6675, n = 5 experiments; and ezrin T567D, n = 17216, n = 7 experiments). C, probability density function of cumulative surface adhesion energies Wad, norm (ezrin T567A, n = 481, n = 4 experiments, ezrin WT n = 299, n = 5 experiments, and ezrin T567D n = 836, n = 7 experiments). Probability density functions were estimated by histogram analysis (gray bars) and kernel density estimation (solid lines). Median values Fad and Wad,norm are given.
FIGURE 7.
FIGURE 7.
Single molecule force experiments. A, representative force retraction curve exhibiting a single molecule rupture event upon retraction of an ezrin T567D functionalized cantilever tip from an F-actin-covered surface. B, histogram showing the adhesion forces obtained from single molecule experiments (n = 5 independent experiments).
FIGURE 8.
FIGURE 8.
Interaction between ezrin T567D and F-actin as a function of applied loading rate in single molecule experiments. A, adhesion force histograms at different loading rates. B, loading rate dependence of mean adhesion force in single molecule experiments (n = 28 independent experiments).
FIGURE 9.
FIGURE 9.
Impact of PIP2 microinjection into confluent MDCK II cells. A–G, fluorescence micrographs of MDCK II cells. The white boxes in the top row images show the regions used for zoom depicted in the middle row images. Cells were stained for PIP2 (A and D, red, Alexa Fluor 546 IgG goat anti-mouse) and ezrin (B and E, green, Alexa Fluor 488 IgG goat anti-mouse). C and F show overlay images from A/B and D/E, respectively. G, fluorescence micrograph of MDCK II cells stained for F-actin (green, Alexa Fluor 488-phalloidin). The arrow marks the PIP2-treated cell. H, box plot distribution showing membrane tension tt of PIP2-treated cells after 3 h (n = 136 retraction curves, n = 4 injected cells) and control (n = 108 retraction curves, n = 5 cells). Whiskers extend from the 20th to the 80th percentile. Asterisks indicate a statistical difference (p < 0.001, Wilcoxon rank sum test).
FIGURE 10.
FIGURE 10.
Influence of gene silencing of ezrin by siRNA in confluent MDCK II cells. A, fluorescence micrograph of cells stained for ezrin (red, Alexa Fluor 546 IgG goat anti-mouse), nucleus (blue, DAPI), and ZO-1 (green, Alexa Fluor 488-conjugated ZO-1 monoclonal antibody). B, box plot distribution showing membrane tension tt of ezrin-depleted cells (n = 85 retraction curves, n = 20 depleted cells) and control (n = 166 retraction curves, n = 13 cells). Whiskers extend from the 20th to the 80th percentile. Asterisks indicate a statistical difference (p < 0.001, Wilcoxon rank sum test).

References

    1. Fehon R. G., McClatchey A. I., Bretscher A. (2010) Organizing the cell cortex: the role of ERM proteins. Nat. Rev. Mol. Cell Biol. 11, 276–287 - PMC - PubMed
    1. Bretscher A., Edwards K., Fehon R. G. (2002) ERM proteins and merlin: integrators at the cell cortex. Nat. Rev. Mol. Cell Biol. 3, 586–599 - PubMed
    1. Zwaenepoel I., Naba A., Da Cunha M. M., Del Maestro L., Formstecher E., Louvard D., Arpin M. (2012) Ezrin regulates microvillus morphogenesis by promoting distinct activities of Eps8 proteins. Mol. Biol. Cell 23, 1080–1094 - PMC - PubMed
    1. Saotome I., Curto M., McClatchey A. I. (2004) Ezrin is essential for epithelial organization and villus morphogenesis in the developing intestine. Dev. Cell 6, 855–864 - PubMed
    1. LaLonde D. P., Garbett D., Bretscher A. (2010) A regulated complex of the scaffolding proteins pdzk1 and ebp50 with ezrin contribute to microvillar organization. Mol. Biol. Cell 21, 1519–1529 - PMC - PubMed

Publication types

MeSH terms

LinkOut - more resources