. 2014 Apr;24(4):697-707.
doi: 10.1101/gr.159624.113. Epub 2014 Feb 5.

Centromere reference models for human chromosomes X and Y satellite arrays

Affiliations

Centromere reference models for human chromosomes X and Y satellite arrays

Karen H Miga et al. Genome Res. 2014 Apr.

Abstract

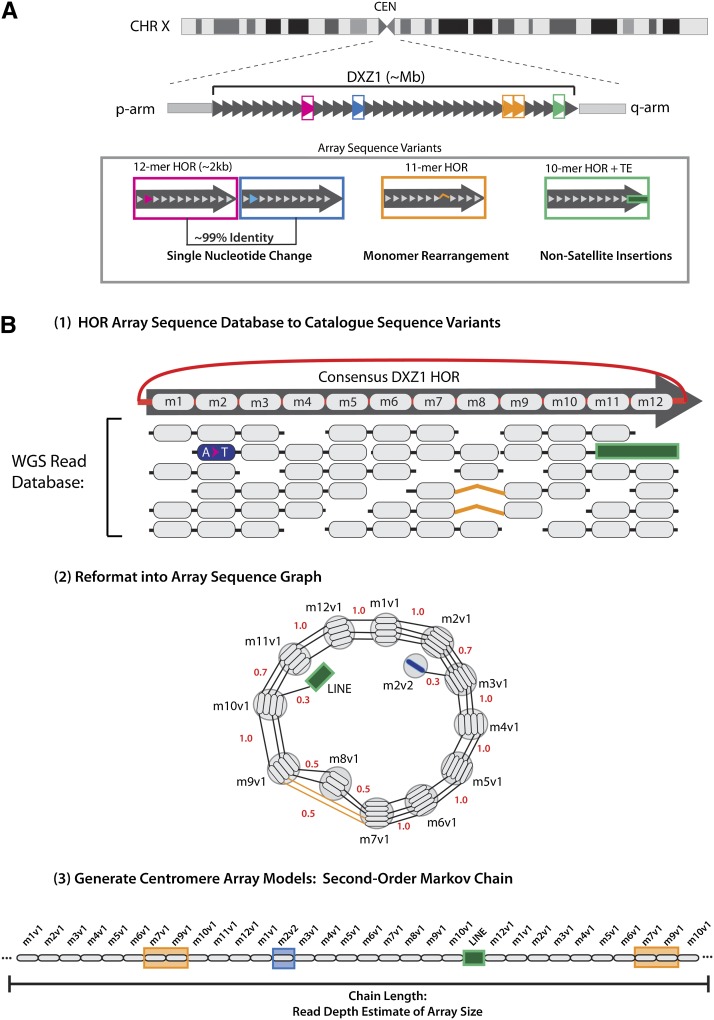
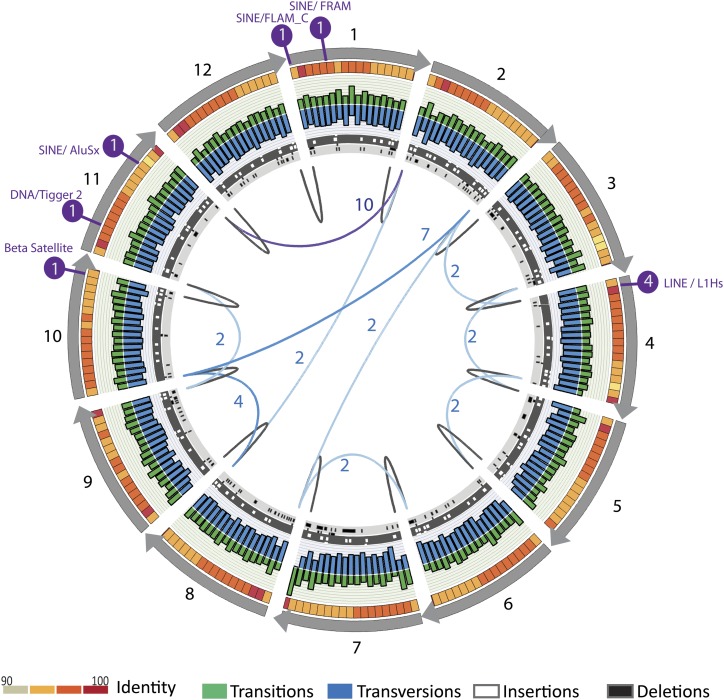
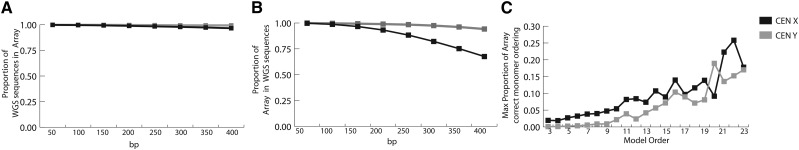
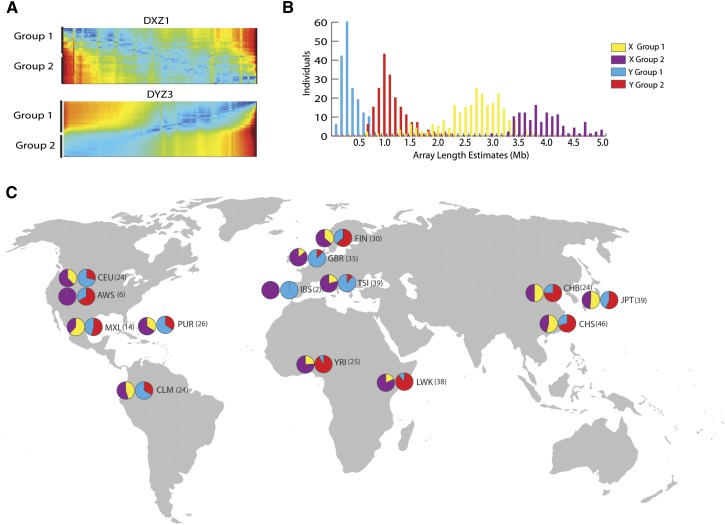
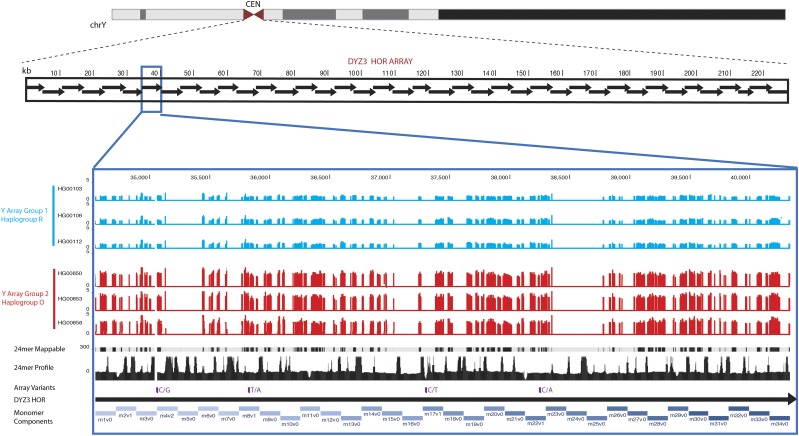
The human genome sequence remains incomplete, with multimegabase-sized gaps representing the endogenous centromeres and other heterochromatic regions. Available sequence-based studies within these sites in the genome have demonstrated a role in centromere function and chromosome pairing, necessary to ensure proper chromosome segregation during cell division. A common genomic feature of these regions is the enrichment of long arrays of near-identical tandem repeats, known as satellite DNAs, which offer a limited number of variant sites to differentiate individual repeat copies across millions of bases. This substantial sequence homogeneity challenges available assembly strategies and, as a result, centromeric regions are omitted from ongoing genomic studies. To address this problem, we utilize monomer sequence and ordering information obtained from whole-genome shotgun reads to model two haploid human satellite arrays on chromosomes X and Y, resulting in an initial characterization of 3.83 Mb of centromeric DNA within an individual genome. To further expand the utility of each centromeric reference sequence model, we evaluate sites within the arrays for short-read mappability and chromosome specificity. Because satellite DNAs evolve in a concerted manner, we use these centromeric assemblies to assess the extent of sequence variation among 366 individuals from distinct human populations. We thus identify two satellite array variants in both X and Y centromeres, as determined by array length and sequence composition. This study provides an initial sequence characterization of a regional centromere and establishes a foundation to extend genomic characterization to these sites as well as to other repeat-rich regions within complex genomes.


Figures

Figure 1.
Figure 1.
An algorithmic overview of satellite characterization and linear representation. (A) Cartoon depiction of centromeric array spanning the complete centromere assigned gap on chromosome X. The multimegabase-sized DXZ1 array is comprised of tandemly arranged higher-order repeats, shown as dark-gray arrows. Examples of array sequence variants are indicated as follows: between pink and blue boxes, single-nucleotide change, illustrated in the second monomer of the HOR; orange box provides a description of monomer rearrangement with a deletion in HOR monomer order; and green box demonstrates a site of transposable element insertion interrupting the repeat. (B) To generate linear representation of these sequences the algorithm uses three key steps: First, an array sequence database is generated, where full-length monomers that are identified on each WGS read are organized relative to the DXZ1 HOR canonical repeat, with sites of variation as indicated. Second, read databases are reformatted into sequence graphs, wherein nodes are defined by identical monomers and edge weights are defined by the normalized read counts that define each observed adjacency in the WGS read database. Finally, traversal of the graph using a second-order Markov model provides a linear description of the original read database: presenting variant sequences in proportion and preserving the local-monomer ordering (defined by length of read database ∼500 bp) as observed in the initial read database.
Figure 2.
Figure 2.
A complete array sequence database across centromeric regions. Monomer sequence identity across each monomer with average percent identity across a 10-bp window, with red color increasing to 100% as provided in the key. Transitions (green) and transversions (blue) relative to the consensus sequence are provided for each 10-bp window (where the sum of each paired transition frequency window and transversion frequency window is 1). Sites of single base-pair insertion (white tracks with dark-gray background) and deletion (dark-gray on light-gray background) are provided as observed in the monomer library. Junctions that describe insertions of RepeatMasker-identified transposable elements are shown in purple with numbers indicating read depth. Consensus links (>3000 read support) between individual monomers are shown in black, nonconsensus links describing rearrangements in the HOR repeat structure ordering are shown in shades of blue, with color intensity increasing with estimated copy number. Image was created using the Circos software (Krzywinski et al. 2009).
Figure 3.
Figure 3.
Evaluation of linear representation of centromeric arrays. (A) Estimate of accurate WGS sequences in processed linear representation of X (black) and Y (gray) linearized centromeric arrays. Read libraries and linearized centromere arrays X and Y are reformatted into k-mer libraries (where k = 50–400 bp with 1-bp slide in both strand orientations), and the proportion of sequences observed in the initial read database are observed in the final database. (B) Estimate of sequences observed in linearized centromeric arrays relative to the initial WGS sequence database, where proportions less than one reflect the gain of novel sequence windows due to the Markov chain model. (C) To determine the improvement of an array long-range prediction, given an increase of model order, simulated long reads were generated at random from each linearized centromeric array (with length defined by monomer order 3–23, with an average monomer of 171 bp), and the longest arrangement of correctly ordered monomers was normalized to the total length of the array.
Figure 4.
Figure 4.
Assessment of array variation in the human population. (A) Hierarchical clustering and heatmap representation of affinity matrices for array-specific 24-mer frequencies across the X and Y centromeres provide evidence for two array groups (1 and 2). (B) Classification labels from spectral clustering of array 24-mer profiles for each individual array demonstrate a bimodal distribution with observed array size (DYZ3 group 1 in blue, group 2 in red; DXZ1 group 1 in yellow, group 2 in purple). Population-based labels assign array groups to particular geographic locations (C).
Figure 5.
Figure 5.
Centromeric reference database and sequence annotation. Linear representation of the DYZ3 array is shown to completely replace the centromere gap placeholder in the chromosome Y reference assembly. Evaluation of monomer ordering across the array predicts 40 higher-order repeat units within a generated array of 227 kb. Increased resolution in the linearized centromeric array demonstrates the monomer sequence order along the bottom in blue shading (labels m1v–m34v), which defines the particular HOR arrangement and the variant sites and base changes observed in the data set (shown in purple). Each 24-bp sliding window across this region demonstrates the representation of these sequences within the HuRef WGS database, with peaks indicating sites that are overrepresented and likely due to exact homology with satellites outside of the Y array. The top 75th percentile mappable sites are provided to extend the survey across other individuals. Six individual array profiles are provided as an example of population-based data, where DYZ3 array group 1 (three individuals from the CEU population) is shown in blue, and array group 2 (three individuals from the CHS population) is shown in red.

Similar articles

Cited by

References

    1. The 1000 Genomes Project Consortium 2012. An integrated map of genetic variation from 1,092 human genomes. Nature 491: 56–65 - PMC - PubMed
    1. Alexandrov IA, Mitkevich SP, Yurov YB 1988. The phylogeny of human chromosome specific α satellites. Chromosoma 96: 443–453 - PubMed
    1. Alexandrov IA, Medvedev LI, Mashkova TD, Kisselev LL, Romanova LY, Yurov YB 1993. Definition of a new α satellite suprachromosomal family characterized by monomeric organization. Nucleic Acids Res 21: 2209–2215 - PMC - PubMed
    1. Bentley DR, Balasubramanian S, Swerdlow HP, Smith GP, Milton J, Brown CG, Hall KP, Evers DJ, Barnes CL, Bignell HR, et al. 2008. Accurate whole human genome sequencing using reversible terminator chemistry. Nature 456: 53–59 - PMC - PubMed
    1. Chang C, Lin C 2011. LIBSVM: a library for support vector machines. ACM Trans Intell Syst Technol 2: 1–27

Publication types

Associated data