. 2014 May 1;217(Pt 9):1626-36.
doi: 10.1242/jeb.090092. Epub 2014 Feb 5.

Recovery of otoacoustic emissions after high-level noise exposure in the American bullfrog

Affiliations

Recovery of otoacoustic emissions after high-level noise exposure in the American bullfrog

Dwayne D Simmons et al. J Exp Biol. .

Erratum in

  • J Exp Biol. 2014 Jun 15;217(Pt 12):2221

Abstract

The American bullfrog (Rana catesbeiana) has an amphibian papilla (AP) that senses airborne, low-frequency sound and generates distortion product otoacoustic emissions (DPOAEs) similar to other vertebrate species. Although ranid frogs are typically found in noisy environments, the effects of noise on the AP have not been studied. First, we determined the noise levels that diminished DPOAE at 2f1-f2 using an f2 stimulus level at 80 dB SPL and that also produced morphological damage of the sensory epithelium. Second, we compared DPOAE (2f1-f2) responses with histopathologic changes occurring in bullfrogs after noise exposure. Consistent morphological damage, such as fragmented hair cells and missing bundles, as well as elimination of DPOAE responses were seen only after very high-level (>150 dB SPL) sound exposures. The morphological response of hair cells to noise differed along the mediolateral AP axis: medial hair cells were sensitive to noise and lateral hair cells were relatively insensitive to noise. Renewed or repaired hair cells were not observed until 9 days post-exposure. Following noise exposure, DPOAE responses disappeared within 24 h and then recovered to normal pre-exposure levels within 3-4 days. Our results suggest that DPOAEs in the bullfrog are sensitive to the initial period of hair cell damage. After noise-induced damage, the bullfrog AP has functional recovery mechanisms that do not depend on substantial hair cell regeneration or repair. Thus, the bullfrog auditory system might serve as an interesting model for investigation of ways to prevent noise damage.

Keywords: Active amplification; Cubic distortion product; Hair Cells; Hearing loss; Regeneration.


Figures
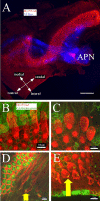
Fig. 1.
Fig. 1.
Overview of bullfrog amphibian papilla. (A) Low-magnification Z-projection of a confocal stack of an amphibian papilla nerve branchlet (APN, blue), indicating its bifurcation and approach to the rostral (left) and caudal (right) amphibian papilla (AP). Myosin VI-labeled (MyoVI, red) hair cells extend throughout the rostral and caudal AP. (B–E) Z-projections of high-magnification confocal stacks of myosin VI-labeled (red) hair cells and cytokeratin-labeled (green) supporting cells in the rostral (B,D) and caudal (C,E) AP regions. Hair cells located on the medial (B,C) and lateral (D,E) margins of the AP have distinct morphologies. Lateral hair cells (D,E) co-express both myosin VI and cytokeratin (yellow arrows). Scale bars: A, 100 μm; B–E, 10 μm.
Fig. 2.
Fig. 2.
Immunolabeling of the AP with antibodies against PSD-95. The panels show PSD-95-labeled puncta surrounding hair cells. (A) Low-magnification confocal image showing PSD-95 immunolabeling (green) with DAPI-stained hair cell nuclei (blue). Yellow arrows identify the same PSD-95-labeled puncta in A and B. In both rostral and caudal AP regions, PSD-95 immunoreactivity was especially robust among mature hair cells (on the medial AP margin). (B) Same image as in A except with phalloidin-stained hair bundles (red) to identify hair cells. (C) Higher magnification projection of confocal images of the medial hair cells showing myosin VI-labeled hair cells (green) in caudal medial AP regions. White arrows identify PSD-95-labeled puncta (red) on medial hair cells. (D) Higher magnification reconstruction of myosin VI-labeled hair cells in rostral medial regions of the AP. White arrows identify PSD-95-labeled puncta (red) on medial hair cells. Scale bars represent 10 μm.
Fig. 3.
Fig. 3.
Cubic distortion products recorded before and after noise exposure in adult bullfrogs. (A) The cubic distortion product (DP) 2f1f2 recorded from the bullfrog ear with primary f1 and secondary f2 frequencies as shown. In this example, secondary levels are 10 dB lower than primary levels. (B) Plot of cubic distortion product otoacoustic emission (DPOAE) levels from the right ear (ipsilateral) versus secondary frequency (f2). DPOAE levels are in decibels relative to 1 V rms (dBV). The plot depicts DPOAE levels recorded before (solid symbols) and 24 h after (open symbols) 150 dB SPL broad-band noise exposure. Filled and open squares represent corresponding pre- and post-noise levels, respectively. At each frequency, the primary stimulus was held constant at 80 dB SPL and the secondary stimulus level was presented at equal strength (solid squares, L1=L2) and then with secondary levels 10 dB lower than primary levels (solid circles, L1>L2). Noise level measurements were taken and averaged on either side of the peak DPOAE level immediately before and after noise exposure, with each ear tested and averaged over three presentations. Dashed lines represent noise floor. (C) Cubic DPOAEs (L1>L2) from the right ear were tested before (day 0) and 1, 2, 5, 6, 7 and 8 days after noise exposure. Dashed lines represent noise floor. (D) Plot of the DPOAE shifts at each frequency tested before (0 days) and following (1, 2, 5, 6, 7 and 8 days) a 20 h noise exposure. The DPOAE shift was calculated as the difference in pre-exposure and post-exposure DPOAE levels.
Fig. 4.
Fig. 4.
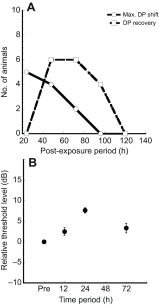
DPOAE recovery. (A) Plot of the number of animals that have a maximum DPOAE shift (solid line) or have a recovered DP (dashed line) versus the post-exposure period. (B) Plot of the mean relative f2 threshold level versus time period. The lowest f2 level with a recordable DPOAE was taken as the threshold and subtracted from the pre-exposure f2 level threshold. The pre-exposure time period was collected immediately before the noise exposure.
Fig. 5.
Fig. 5.
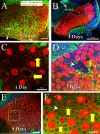
Noise-damaged AP hair cells. (A–E) Myosin VI-labeled (red) hair cells and cytokeratin-labeled (green) supporting cells in the AP after exposure to noise levels up to 134 dB SPL for 20 h (A) and noise levels at 150 dB SPL for 20 h (B–E). In all panels, the lateral edge is as indicated in A and the medial margin is as indicated in B. Fragmenting hair cells (yellow arrows, C) and epithelial holes (white arrow, D), seen 1 and 3 days after noise exposure, were confined to a narrow region along the medial margin of the caudal region (B). (D–F) Myosin VI- and phalloidin-labeled (red) hair cells and cytokeratin-labeled (green) supporting cells, 3 and 9 days after noise exposure, showing epithelial scar formations (white arrow, F), restoration of intercellular junctions, and the appearance of regenerating hair cells (yellow vertical arrows, F). The box in E is shown at higher magnification in F. Scale bars: 30 μm (A,E); 100 μm (B); 10 μm (C,F). Scale is the same in C and D.
Fig. 6.
Fig. 6.
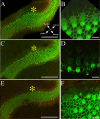
Hair cell loss in damaged AP regions. Low-magnification (A,C,E) and high-magnification (B,D,F) images of caudal hair cells from normal (A,B) and noise-exposed ears 3 days (C,D) and 9 days (E,F) post-exposure to a high-intensity, 800 Hz tone. Myosin VI and phalloidin are both labeled green. Neurofilament is labeled red. The asterisks represent the same region in each AP as measured from the caudal tail. Regions of epithelial scar formations (S) are also shown. Scale bars: 100 μm (A,C,E) and 10 μm (B,D,F).
Fig. 7.
Fig. 7.
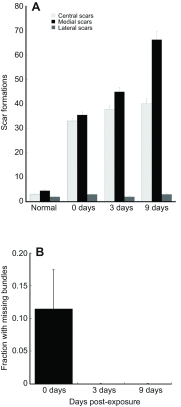
Epithelial scars and missing hair bundles. (A) The number of epithelial scars was plotted in normal ears and exposed ears after 0, 3 and 9 days. Epithelial scars were counted in 100 μm distance bins from the end (tip) of the caudal extension of an exposed ear and non-exposed ear from the same animal. (B) The fraction of hair cells with missing bundles was plotted in exposed ears after 0, 3 and 9 days. Only mature hair cells in exposed ears showed a significant number of missing stereocilia bundles.
Fig. 8.
Fig. 8.
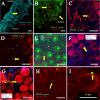
PSD-95 and neurofilament labeling after noise exposure. (A) An unexposed control AP labeled with myosin VI (blue) and PSD-95 (red). PSD-95 puncta (yellow arrow) are found on medial hair cells and not lateral hair cells. (B) After a short (4 h) noise exposure (150 dB SPL), PSD-95 immunoreactivity (red) dramatically increases on medial hair cells. AP hair cells are labeled with myosin VI (green). Yellow arrows identify PSD-95 puncta surrounding the basolateral portions of hair cells. (C) Myosin VI-labeled hair cells (red), PSD-95 labeled puncta (green) and neurofilament (NF) labeled fibers (red) 1 day after a 20 h noise exposure. Yellow arrow identifies PSD-95 puncta apposed to a myosin VI-labeled medial hair cell. (D) Myosin VI-labeled hair cells (red) and PSD-95 labeled puncta (green) 3 days after a 20 h noise exposure. Yellow arrow shows PSD-95 puncta overlapping with myosin VI-labeled fragment. (E) Luminal surface view of myosin VI- and phalloidin-labeled hair cells (green) 9 days after a 20 h sound exposure, showing restoration of scars and intercellular junctions (asterisk), and the appearance of regenerating hair cells (yellow arrow). (F) A view near the basement membrane of a sound-exposed caudal AP 9 days after sound exposure. Myosin VI-labeled hair cells (red) are contacted by neurofilament-labeled (blue) fibers (yellow arrow). (G) Recovered hair cells 14 days after sound exposure. This region of the AP has new connections from neurofilament-labeled (blue) auditory neurons (yellow arrow). (H) At 14 days after sound exposure, punctate PSD-95 immunoreactivity (yellow arrow) was also seen closer to the basement membrane within scar formations. (I) Higher magnification image of a myosin VI-labeled hair cell (red) from H showing punctate PSD-95 immunoreactivity (green; yellow arrow) by 14 days post-sound exposure. All scale bars represent 10 μm.

References

    1. Baird R. A., Burton M. D., Lysakowski A., Fashena D. S., Naeger R. A. (2000). Hair cell recovery in mitotically blocked cultures of the bullfrog saccule. Proc. Natl. Acad. Sci. USA 97, 11722-11729 - PMC - PubMed
    1. Baker R. J., Wilson J. P., Whitehead M. L. (1989). Otoacoustic evidence for nonlinear behavior in frog hearing: suppression but no distortion products. In Cochlear Mechanisms: Structure, Function and Models (ed. Wilson J., Kemp D. T.), pp. 349-356 New York, NY: Plenum;
    1. Bao J., Lin H., Ouyang Y., Lei D., Osman A., Kim T.-W., Mei L., Dai P., Ohlemiller K. K., Ambron R. T. (2004). Activity-dependent transcription regulation of PSD-95 by neuregulin-1 and Eos. Nat. Neurosci. 7, 1250-1258 - PubMed
    1. Bozovic D., Hudspeth A. J. (2003). Hair-bundle movements elicited by transepithelial electrical stimulation of hair cells in the sacculus of the bullfrog. Proc. Natl. Acad. Sci. USA 100, 958-963 - PMC - PubMed
    1. Brown D. K., Bowman D. M., Kimberley B. P. (2000). The effects of maturation and stimulus parameters on the optimal f(2)/f(1) ratio of the 2f(1)-f(2) distortion product otoacoustic emission in neonates(1). Hear. Res. 145, 17-24 - PubMed

Publication types