. 2014 Apr 3;123(14):2261-8.
doi: 10.1182/blood-2013-02-480095. Epub 2014 Feb 5.

The type I BMP receptor Alk3 is required for the induction of hepatic hepcidin gene expression by interleukin-6

Affiliations

The type I BMP receptor Alk3 is required for the induction of hepatic hepcidin gene expression by interleukin-6

Claire Mayeur et al. Blood. .

Abstract

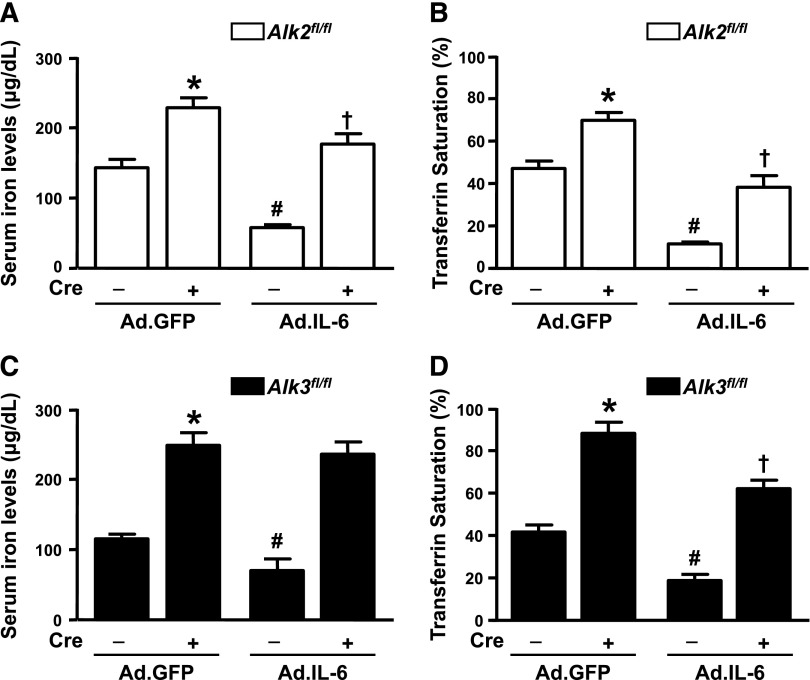
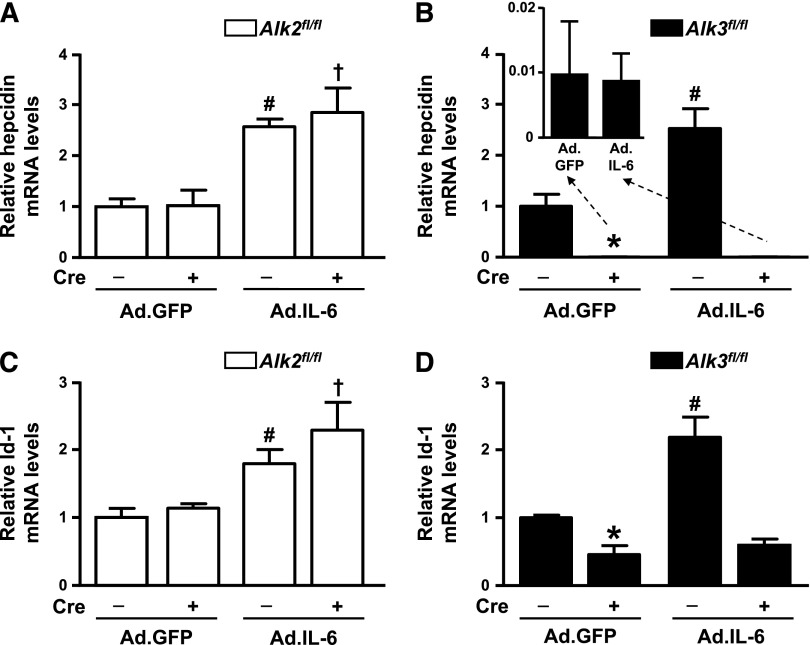
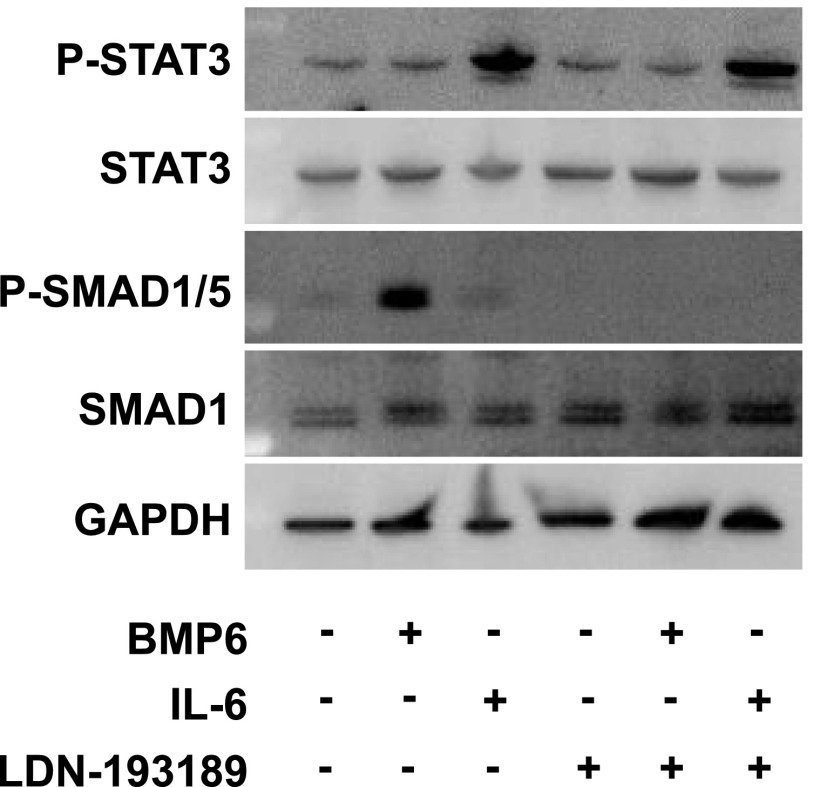
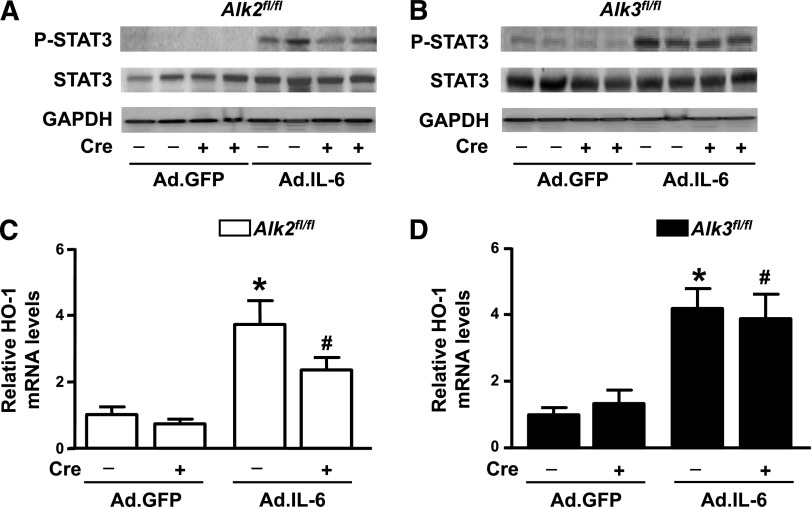
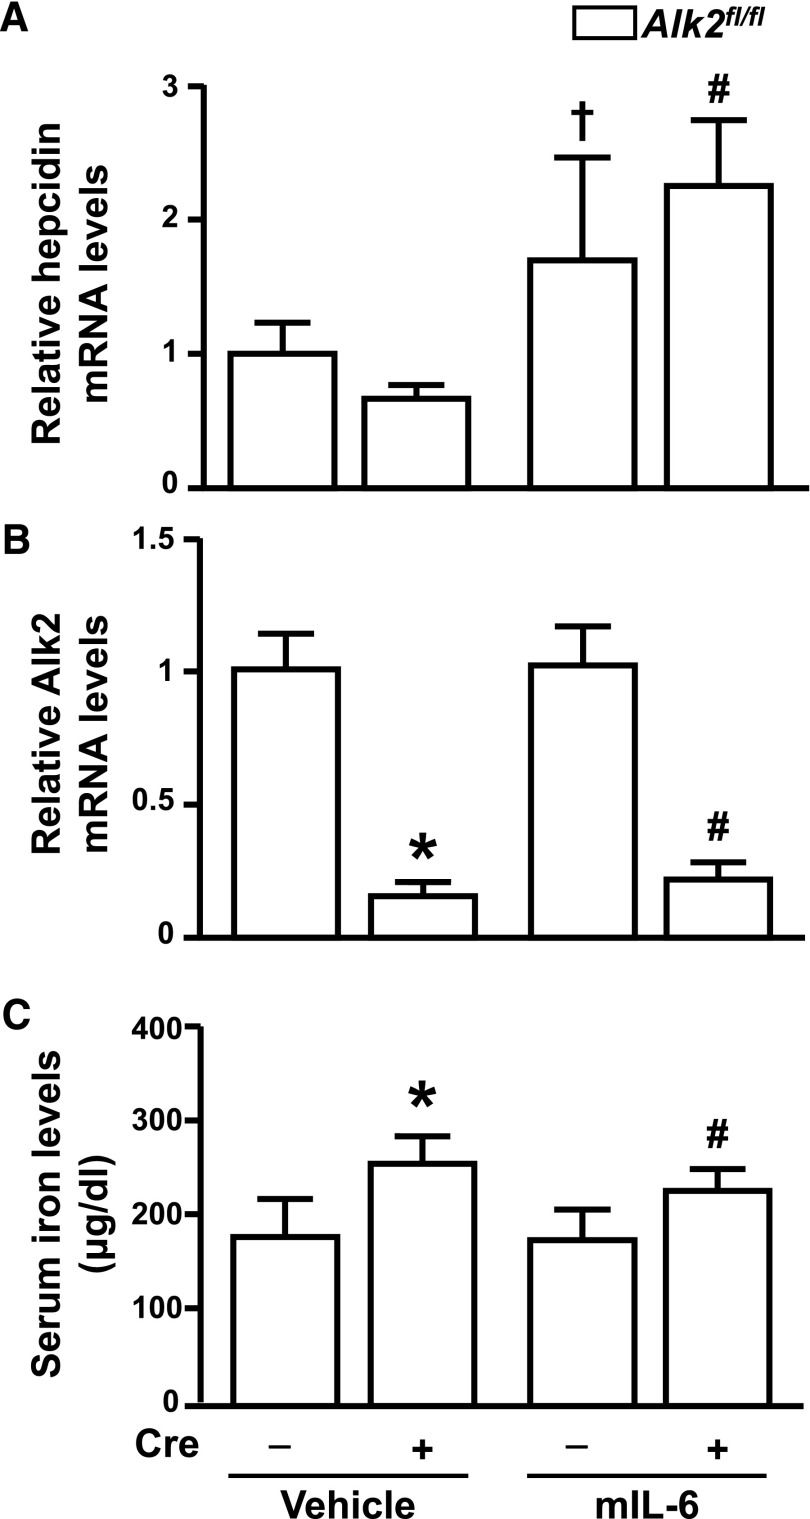
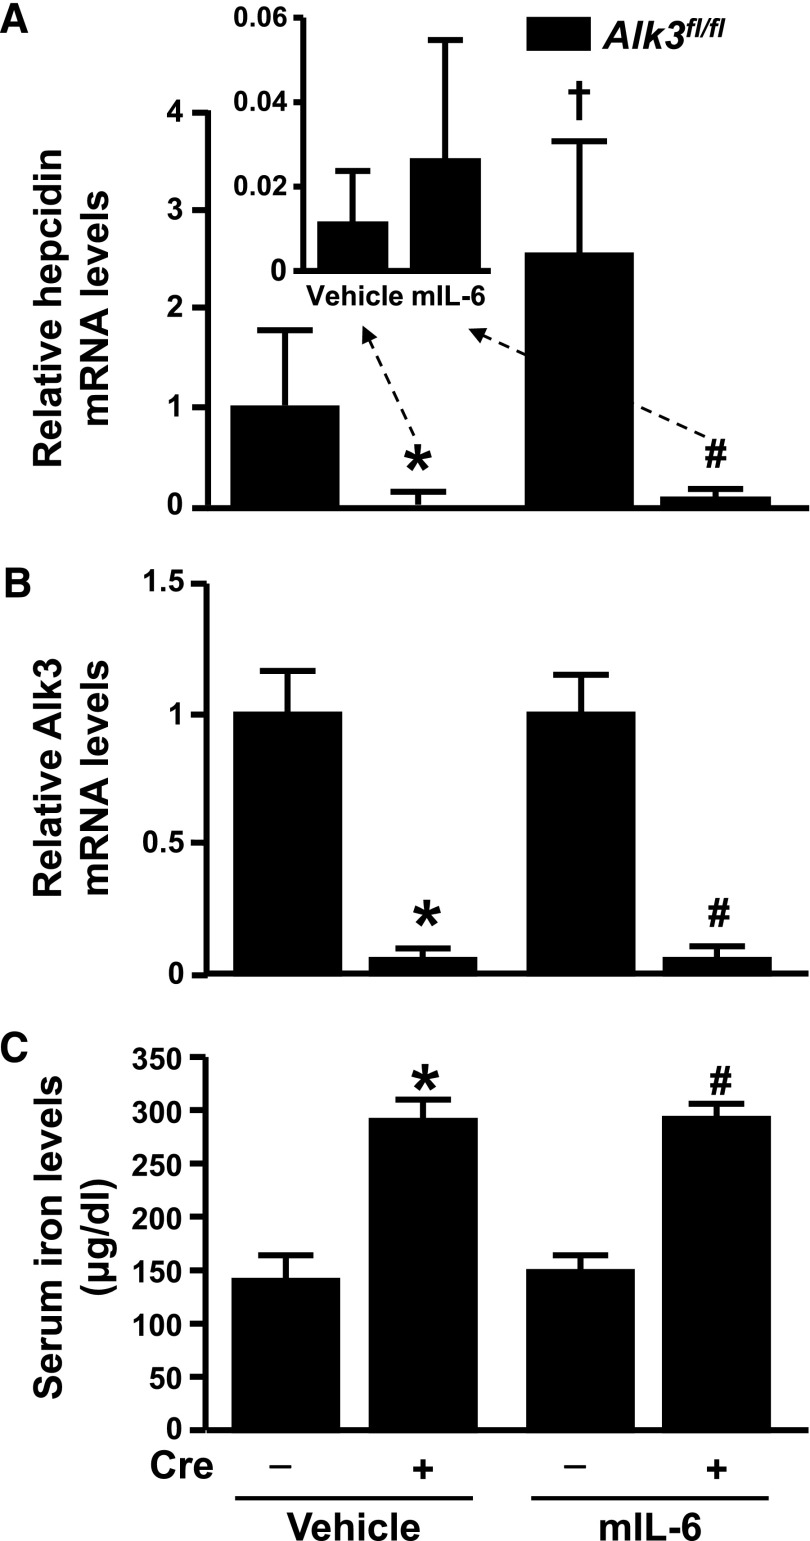
Increased IL-6 production induces, via STAT3 phosphorylation, hepatic transcription of the gene encoding the iron-regulatory hormone, hepcidin, leading to development of anemia of chronic disease (ACD). Inhibition of bone morphogenetic protein (BMP) signaling prevents the induction of hepcidin gene expression by IL-6 and ameliorates ACD. Using mice with hepatocyte-specific deficiency of Alk2 or Alk3, we sought to identify the BMP type I receptor that participates in IL-6-mediated induction of hepcidin gene expression. Mice were injected with adenovirus specifying IL-6 (Ad.IL-6) or control adenovirus. Seventy-two hours later, serum iron concentrations and hepatic levels of STAT3 phosphorylation and hepcidin messenger RNA were measured. Additional mice were injected with recombinant murine IL-6 (mIL-6) or vehicle, and hepatic hepcidin gene expression was measured 4 hours later. Deficiency of Alk2 or Alk3 did not alter the ability of Ad.IL-6 injection to induce hepatic STAT3 phosphorylation. Ad.IL-6 increased hepatic hepcidin messenger RNA levels and decreased serum iron concentrations in Alk2- but not Alk3-deficient mice. Similarly, administration of mIL-6 induced hepatic hepcidin gene expression in Alk2- but not Alk3-deficient mice. These results demonstrate that the ability of IL-6 to induce hepatic hepcidin gene expression and reduce serum iron concentrations is dependent on the BMP type I receptor Alk3.


Figures

Figure 1
Figure 1
Serum iron concentrations and transferrin saturation in mice injected with Ad.GFP or Ad.IL-6. (A) Serum iron concentrations were measured in Alk2fl/fl and Alk2fl/fl; Alb-Cre mice 72 hours after intravenous injection of 1 × 10¹¹ virus particles of an adenovirus specifying green fluorescent protein (Ad.GFP) or an adenovirus specifying interleukin 6 (Ad.IL-6). The presence of the Cre recombinase transgene is indicated below the x-axis as Cre “+” (1-way ANOVA, P = .0018. *P = .006: Alk2fl/fl mice injected with Ad.GFP [n = 3] vs Alk2fl/fl; Alb-Cre mice injected with Ad.GFP [n = 5]; #P = .02: Alk2fl/fl mice injected with Ad.GFP vs Alk2fl/fl mice injected with Ad.IL-6 [n = 5]; P = .03: Alk2fl/fl; Alb-Cre mice injected with Ad.GFP vs Alk2fl/fl; Alb-Cre mice injected with Ad.IL-6 [n = 7]). (B) Transferrin saturations in Alk2fl/fl and Alk2fl/fl; Alb-Cre mice 72 hours after intravenous injection of Ad.GFP or Ad.IL-6 (1-way ANOVA, P = .001; *P = .007: Alk2fl/fl mice injected with Ad.GFP vs Alk2fl/fl; Alb-Cre mice injected with Ad.GFP; #P = .01: Alk2fl/fl injected with Ad.GFP vs Alk2fl/fl injected with Ad.IL-6; P = .001: Alk2fl/fl; Alb-Cre mice injected with Ad.GFP vs Alk2fl/fl; Alb-Cre mice injected with Ad.IL-6). (C) Serum iron concentrations were measured in Alk3fl/fl and Alk3fl/fl; Alb-Cre mice injected with Ad.GFP or Ad.IL-6 (1-way ANOVA, P = .0016; *P = .0004: Alk3fl/fl mice injected with Ad.GFP [n = 4] vs Alk3fl/fl; Alb-Cre mice injected with Ad.GFP [n = 6]; #P = .0445: Alk3fl/fl mice injected with Ad.GFP vs Alk3fl/fl mice injected with Ad.IL-6 [n = 4]). Serum iron concentrations in Alk3fl/fl; Alb-Cre mice injected with Ad.GFP did not differ from those in Alk3fl/fl; Alb-Cre mice injected with Ad.IL-6 (P = .6). (D) Transferrin saturations in Alk3fl/fl and Alk3fl/fl; Alb-Cre mice 72 hours after injection with Ad.GFP or Ad.IL-6 (1-way ANOVA, P = .0004; *P = .0001: Alk3fl/fl mice injected with Ad.GFP vs Alk3fl/fl; Alb-Cre mice injected with Ad.GFP; #P = .004: Alk3fl/fl mice injected with Ad.GFP vs Alk3fl/fl mice injected with Ad.IL-6; P = .003: Alk3fl/fl; Alb-Cre mice injected with Ad.GFP vs Alk3fl/fl; Alb-Cre mice injected with Ad.IL-6).
Figure 2
Figure 2
Hepatic hepcidin and Id-1 mRNA levels in mice 72 hours after injection with Ad.IL-6 or Ad.GFP. (A) Hepatic hepcidin mRNA levels were determined by quantitative RT-PCR in Alk2fl/fl and Alk2fl/fl; Alb-Cre mice (1-way ANOVA, P = .009; #P = .0008: Alk2fl/fl mice injected with Ad.GFP [n = 3] vs Alk2fl/fl mice injected with Ad.IL-6 [n = 5]; P = .01: Alk2fl/fl; Alb-Cre mice injected with Ad.GFP [n = 4] vs Alk2fl/fl; Alb-Cre mice injected with Ad.IL-6 [n = 7]). (B) Hepatic hepcidin mRNA levels in Alk3fl/fl and Alk3fl/fl; Alb-Cre mice (1-way ANOVA, P = .0005; *P = .03: Alk3fl/fl mice injected with Ad.GFP [n = 4] vs Alk3fl/fl; Alb-Cre mice injected with Ad.GFP [n = 6]; #P = .02: Alk3fl/fl mice injected with Ad.GFP vs Alk3fl/fl mice injected with Ad.IL-6 [n = 5]). As highlighted in the inset, hepatic hepcidin mRNA levels in Alk3fl/fl; Alb-Cre mice injected with Ad.GFP did not differ from those in Alk3fl/fl; Alb-Cre mice injected with Ad.IL-6. (C) Hepatic Id-1 mRNA levels in Alk2fl/fl and Alk2fl/fl; Alb-Cre mice injected with Ad.GFP or Ad.IL-6 (1-way ANOVA, P = .01; #P < .04: Alk2fl/fl mice injected with Ad.GFP [n = 3] vs Alk2fl/fl mice injected with Ad.IL-6 [n = 5]; P = .0045: Alk2fl/fl; Alb-Cre mice injected with Ad.GFP [n = 4] vs Alk2fl/fl; Alb-Cre mice injected with Ad.IL-6 [n = 5]). (D) Hepatic Id-1 mRNA levels in Alk3fl/fl and Alk3fl/fl; Alb-Cre mice injected with Ad.GFP or Ad.IL-6 (1-way ANOVA, P = .0023; *P = .01: Alk3fl/fl injected with Ad.GFP vs Alk3fl/fl; Alb-Cre mice injected with Ad.GFP [n = 5]; #P = .024: Alk3fl/fl mice injected with Ad.GFP vs Alk3fl/fl mice injected with Ad.IL-6 [n = 5]). Hepatic Id-1 mRNA levels in Alk3fl/fl; Alb-Cre mice injected with Ad.GFP did not differ from those in Alk3fl/fl; Alb-Cre mice injected with Ad.IL-6.
Figure 3
Figure 3
Inhibition of BMP signaling is independent of STAT3 phosphorylation in HepG2 cells. Hepatocarcinoma cells (HepG2) were treated with and without LDN-193189 (100 nM). Thirty minutes later, cells were stimulated without or with BMP6 (5 ng/mL) or IL-6 (100 ng/mL) for an additional 30 minutes and harvested. Levels of phosphorylated STAT3 (P-STAT3), total STAT3, phosphorylated SMAD1/5 (P-SMAD1/5), total SMAD1, and GAPDH were detected on different immunoblots using the same samples. Experiments were performed 3 times, with the representative results shown.
Figure 4
Figure 4
Hepatic STAT3 phosphorylation in response to IL-6 in vivo. (A) Hepatic levels of phosphorylated STAT3 (P-STAT3), total STAT3, and GAPDH were determined using immunoblot techniques in Alk2fl/fl and Alk2fl/fl; Alb-Cre mice 72 hours after injection with Ad.GFP or Ad.IL-6. (B) Hepatic levels of P-STAT3, total STAT3, and GAPDH were determined using immunoblot techniques in Alk3fl/fl and Alk3fl/fl; Alb-Cre mice injected with Ad.GFP or Ad.IL-6 for 72 hours. (C) Hepatic HO-1 mRNA levels 72 hours after injection of Ad.GFP or Ad.IL-6 were determined by quantitative RT-PCR (1-way ANOVA, P = .0038; *P = .02: Alk2fl/fl injected with Ad.GFP [n = 3] vs Alk2fl/fl injected with Ad.IL-6 [n = 5]; #P = .005: Alk2fl/fl; Alb-Cre mice injected with Ad.GFP [n = 4] vs Alk2fl/fl; Alb-Cre mice injected with Ad.IL-6 [n = 7]). There was no difference between hepatic HO-1 mRNA levels in Alk2fl/fl and Alk2fl/fl; Alb-Cre mice after injection with Ad.IL-6. (D) Hepatic HO-1 mRNA levels in Alk3fl/fl and Alk3fl/fl; Alb-Cre mice (1-way ANOVA, P = .007; *P = .0074: Alk3fl/fl injected with Ad.GFP vs Alk3fl/fl injected with Ad.IL-6 [n = 5]; #P = .02: Alk3fl/fl; Alb-Cre mice injected with Ad.GFP [n = 6] vs Alk3fl/fl; Alb-Cre mice injected with Ad.IL-6 [n = 5]).
Figure 5
Figure 5
Hepatic hepcidin gene expression and serum iron levels in hepatocyte-specific Alk2-deficient mice challenged with mIL-6. Male Alk2fl/fl and Alk2fl/fl; Alb-Cre mice were injected intraperitoneally with mIL-6 (n = 5 and 6, in each group, respectively) or vehicle (0.1% BSA in PBS) (n = 5 and 3, in each group, respectively). After 4 hours, blood was collected, mice were euthanized and their livers were harvested. (A) Hepatic hepcidin mRNA levels. (1 way-ANOVA, P = .0011, : P < .05: Alk2fl/fl mice injected with vehicle vs Alk2fl/fl mice injected with mIL-6; #P < .005: Alk2fl/fl; Alb-Cre mice injected with vehicle vs Alk2fl/fl; Alb-Cre mice injected with mIL-6. (B) Alk2 mRNA levels (1 way-ANOVA, P < .0001; *P < .0001: Alk2fl/fl mice injected with vehicle vs Alk2fl/fl; Alb-Cre mice injected with vehicle; #P < .0001: Alk2fl/fl mice injected with mIL-6 vs Alk2fl/fl; Alb-Cre mice injected with mIL-6). (C) Serum iron levels (1 way-ANOVA, P = .0017; *P < .02: Alk2fl/fl mice injected with vehicle vs Alk2fl/fl; Alb-Cre mice injected with vehicle; #P < .02: Alk2fl/fl mice injected with mIL-6 vs Alk2fl/fl; Alb-Cre mice injected with mIL-6).
Figure 6
Figure 6
Hepatic hepcidin gene expression and serum iron levels in hepatocyte-specific Alk3-deficient mice challenged with mIL-6. Male Alk3fl/fl and Alk3fl/fl; Alb-Cre mice were injected intraperitoneally with mIL-6 (n = 5 and 6, in each group, respectively) or vehicle (0.1% BSA in PBS; n = 5 and 3, in each group, respectively) and were euthanized after 4 hours. (A) Hepatic hepcidin mRNA levels in Alk3fl/fl and Alk3fl/fl; Alb-Cre mice injected with mIL-6 or vehicle (1 way-ANOVA, P < .0001; *P = .0027: Alk3fl/fl mice injected with vehicle vs Alk3fl/fl; Alb-Cre mice injected with vehicle; P < .0001: Alk3fl/fl mice injected with vehicle vs Alk3fl/fl mice injected with mIL-6; #P < .0001: Alk3fl/fl mice injected with mIL-6 vs Alk3fl/fl; Alb-Cre mice injected with mIL-6). As depicted in an inset, hepatic hepcidin mRNA levels in Alk3fl/fl; Alb-Cre mice injected with mIL-6 did not differ from those in Alk3fl/fl; Alb-Cre mice injected with vehicle. (B) Alk3 mRNA levels (1 way-ANOVA, P < .0001; *P < .0001: Alk3fl/fl mice injected with vehicle vs Alk3fl/fl; Alb-Cre mice injected with vehicle; #P < .0001: Alk3fl/fl mice injected with mIL-6 vs Alk3fl/fl; Alb-Cre mice injected with mIL-6). (C) Serum iron levels (1 way-ANOVA, P < .0001; *P < .0001: Alk3fl/fl mice injected with vehicle vs Alk3fl/fl; Alb-Cre mice injected with vehicle; #P < .0001: Alk3fl/fl mice injected with mIL-6 vs Alk3fl/fl; Alb-Cre mice injected with mIL-6).

References

    1. Weiss G, Goodnough LT. Anemia of chronic disease. N Engl J Med. 2005;352(10):1011–1023. - PubMed
    1. Nicolas G, Bennoun M, Porteu A, et al. Severe iron deficiency anemia in transgenic mice expressing liver hepcidin. Proc Natl Acad Sci USA. 2002;99(7):4596–4601. - PMC - PubMed
    1. Sasu BJ, Cooke KS, Arvedson TL, et al. Antihepcidin antibody treatment modulates iron metabolism and is effective in a mouse model of inflammation-induced anemia. Blood. 2010;115(17):3616–3624. - PubMed
    1. Nicolas G, Chauvet C, Viatte L, et al. The gene encoding the iron regulatory peptide hepcidin is regulated by anemia, hypoxia, and inflammation. J Clin Invest. 2002;110(7):1037–1044. - PMC - PubMed
    1. Pigeon C, Ilyin G, Courselaud B, et al. A new mouse liver-specific gene, encoding a protein homologous to human antimicrobial peptide hepcidin, is overexpressed during iron overload. J Biol Chem. 2001;276(11):7811–7819. - PubMed

Publication types