. 2014 Apr;111(8):1671-85.
doi: 10.1152/jn.00436.2013. Epub 2014 Feb 5.

Selectivity for space and time in early areas of the auditory dorsal stream in the rhesus monkey

Affiliations

Selectivity for space and time in early areas of the auditory dorsal stream in the rhesus monkey

Pawel Kusmierek et al. J Neurophysiol. 2014 Apr.

Abstract

The respective roles of ventral and dorsal cortical processing streams are still under discussion in both vision and audition. We characterized neural responses in the caudal auditory belt cortex, an early dorsal stream region of the macaque. We found fast neural responses with elevated temporal precision as well as neurons selective to sound location. These populations were partly segregated: Neurons in a caudomedial area more precisely followed temporal stimulus structure but were less selective to spatial location. Response latencies in this area were even shorter than in primary auditory cortex. Neurons in a caudolateral area showed higher selectivity for sound source azimuth and elevation, but responses were slower and matching to temporal sound structure was poorer. In contrast to the primary area and other regions studied previously, latencies in the caudal belt neurons were not negatively correlated with best frequency. Our results suggest that two functional substreams may exist within the auditory dorsal stream.

Keywords: azimuth; caudal belt; elevation; latency; temporal precision.


Figures

Fig. 1.
Fig. 1.
Spectrograms of monkey calls (MC) and environmental sounds (ES) used in the study. Top: MC: bark, coo, girney, grunt, harmonic arch, pant threat, scream. Middle and bottom: ES: cage latch, monkey chair latch opening, moving food container, water dripping, padlock open, monkey pole latch, vacuum pump.
Fig. 2.
Fig. 2.
Maps of best (center) frequencies (BF) in all 3 monkeys; recording grid coordinates in millimeters. Top: raw data. Bottom: data smoothed with Gaussian kernel (σ = 0.5 mm). Cortical area boundaries and designations are drawn in black. In monkey N (left) several locations in the lateral part of caudomedial area (CM) were not recorded from because of a large blood vessel detected in the MRI images. Arrows show direction of cochleotopic gradients (low to high BF) detected in each area. Black arrows indicate significant gradients (P < 0.05) and gray arrows nonsignificant gradients. Three arrows per area show results obtained with 3 stimulus bandwidths: pure tones (PT), ⅓-octave band-pass noise (BPN), and 1-octave BPN. CL, caudolateral area.
Fig. 3.
Fig. 3.
Frequency selectivity in individual units of areas A1, CM, and CL, as measured with PT (left), ⅓-octave BPN (center), and 1-octave BPN (right). A: cumulative distributions of the preference index (PI) for stimulus frequency; high/low PI values indicate low/high selectivity, respectively. B: cumulative distributions of linear discriminator performance (proportion correct identifications); high/low linear discriminator performance values indicate high/low selectivity, respectively. C: mean (+SD) number of peaks in the frequency-peak firing rate (PFR) curve. n.s., Not significant.
Fig. 4.
Fig. 4.
Selectivity for natural sounds in individual units of areas A1, CM, and CL. Left: MC. Right: ES. A: cumulative distributions of PI; high/low PI values indicate low/high selectivity, respectively. B: cumulative distributions of the linear discriminator performance (proportion correct identifications); high/low linear discriminator performance values indicate high/low selectivity, respectively.
Fig. 5.
Fig. 5.
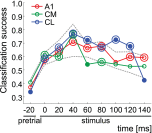
Discrimination of sound stimulus categories based on neural population responses in areas A1, CM, and CL. Mean classification success with k-means clustering; k = 4 categories (low-frequency PT/BPN, high-frequency PT/BPN, MC, ES). Data from a 20-ms pretrial period preceding the stimulus onset are shown on left, followed by “stimulus” data from 8 consecutive 20-ms time bins covering 0–160 ms of stimulus. Double circles denote classification success that was significantly higher (P < 0.05) than pretrial classification success; filled circles represent stimulus classification success outside the reference range (P < 0.05; see Kuśmierek et al. 2012). Dashed lines show boundaries of the reference range estimated by randomly reassigning the neurons to regions and repeating the k-means analysis in an identical way. Values on x-axis denote onset of analysis bin.
Fig. 6.
Fig. 6.
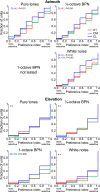
Spatial selectivity in units of areas A1, CM, and CL, measured with best PT, best ⅓-octave BPN, best 1-octave BPN, and white noise (WN): cumulative distributions of PI for azimuth (top) and elevation (bottom). Note that high selectivity is indicated by low PI values while low selectivity is indicated by high PI values.
Fig. 7.
Fig. 7.
Response latencies in areas A1, CM, and CL. Left: distribution of latencies. Color blocks show the interquartile range (median marked with white line). Below the lower quartile or above the upper quartile, individual data points are shown (jittered to improve readability). Right: correlation of response latency and BF for areas A1, CM, and CL. Individual unit data are shown with dots (shifted along x-axis to improve readability), and regression lines for each area are shown with lines.
Fig. 8.
Fig. 8.
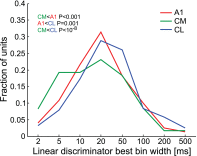
Distributions of linear discriminator best bin width, an indicator of how precisely neural response patterns are replicated from trial to trial, for areas A1, CM, and CL. Data are pooled from separate analyses conducted on PT, ⅓-octave BPN, 1-octave BPN, MC, and ES.
Fig. 9.
Fig. 9.
Mean (+SD) correlation coefficient between acoustic energy within MC and ES stimuli and firing rate, quantifying the ability of units in areas A1, CM, and CL to follow temporal structure of the stimuli. P values shown in parentheses were obtained from Kolmogorov-Smirnov tests. Left and center: mean + SD. Right: same data as in center displayed as distributions constructed by binning the entire data range into 1,000 bins and smoothing with a Gaussian kernel (σ = 10 bins).
Fig. 10.
Fig. 10.
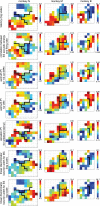
Maps of neural parameters that were identified as potentially useful for distinction between CM and CL on the basis of response properties, from top to bottom: log latency, correlation coefficient between acoustic energy within ES stimuli and firing rate, azimuth PI for ⅓-octave BPN, azimuth PI for WN, elevation PI for wideband stimuli, linear discriminator best bin width for MC, linear discriminator best bin width for ES. Maps smoothed with Gaussian kernel (σ = 0.75 mm). Data from each monkey shown in separate column. Black lines show area boundaries established for this study; axis labels omitted to reduce clutter; compare Fig. 2 and Fig. 11.
Fig. 11.
Fig. 11.
Separation of caudal belt areas using the first principal component (PC) derived from 7 neural parameters: 1) log latency, 2) correlation coefficient between acoustic energy within ES stimuli and firing rate, 3) azimuth PI for ⅓-octave BPN, 4) azimuth PI for WN, 5) elevation PI for wideband stimuli, 6) linear discriminator best bin width for MC, 7) linear discriminator best bin width for ES (see also Fig. 10). A: % variance explained by successive PCs, per component (bars) and cumulative (line). B: component coefficients (correlation coefficients between the components and neural parameters). First 3 components (PC1, PC2, PC3) are shown; neural parameters are represented by numbers. C: maps of values of PC1 in each monkey, smoothed with Gaussian kernel (σ = 0.75 mm). Area boundaries based on BF and gross anatomy (see materials and methods and Fig. 2). In all monkeys, low values of PC1 tend to map to CM and high values to CL.

Similar articles

Cited by

References

    1. Ahveninen J, Jääskeläinen IP, Raij T, Bonmassar G, Devore S, Hämäläinen M, Levänen S, Lin FH, Sams M, Shinn-Cunningham BG, Witzel T, Belliveau JW. Task-modulated “what” and “where” pathways in human auditory cortex. Proc Natl Acad Sci USA 103: 14608–14613, 2006 - PMC - PubMed
    1. Andersen RA. Multimodal integration for the representation of space in the posterior parietal cortex. Philos Trans R Soc Lond B Biol Sci 352: 1421–1428, 1997 - PMC - PubMed
    1. Arnott SR, Binns MA, Grady CL, Alain C. Assessing the auditory dual pathway model in humans. Neuroimage 22: 401–408, 2004 - PubMed
    1. Bartlett EL, Wang X. Correlation of neural response properties with auditory thalamus subdivisions in the awake marmoset. J Neurophysiol 105: 2647–2667, 2011 - PMC - PubMed
    1. Belin P, Zatorre RJ. “What”, “where” and “how” in auditory cortex. Nat Neurosci 3: 965–966, 2000 - PubMed

Publication types

LinkOut - more resources