. 2014 Feb 5;34(6):2087-99.
doi: 10.1523/JNEUROSCI.4646-13.2014.

Transgenic mouse lines subdivide external segment of the globus pallidus (GPe) neurons and reveal distinct GPe output pathways

Affiliations

Transgenic mouse lines subdivide external segment of the globus pallidus (GPe) neurons and reveal distinct GPe output pathways

Kevin J Mastro et al. J Neurosci. .

Abstract

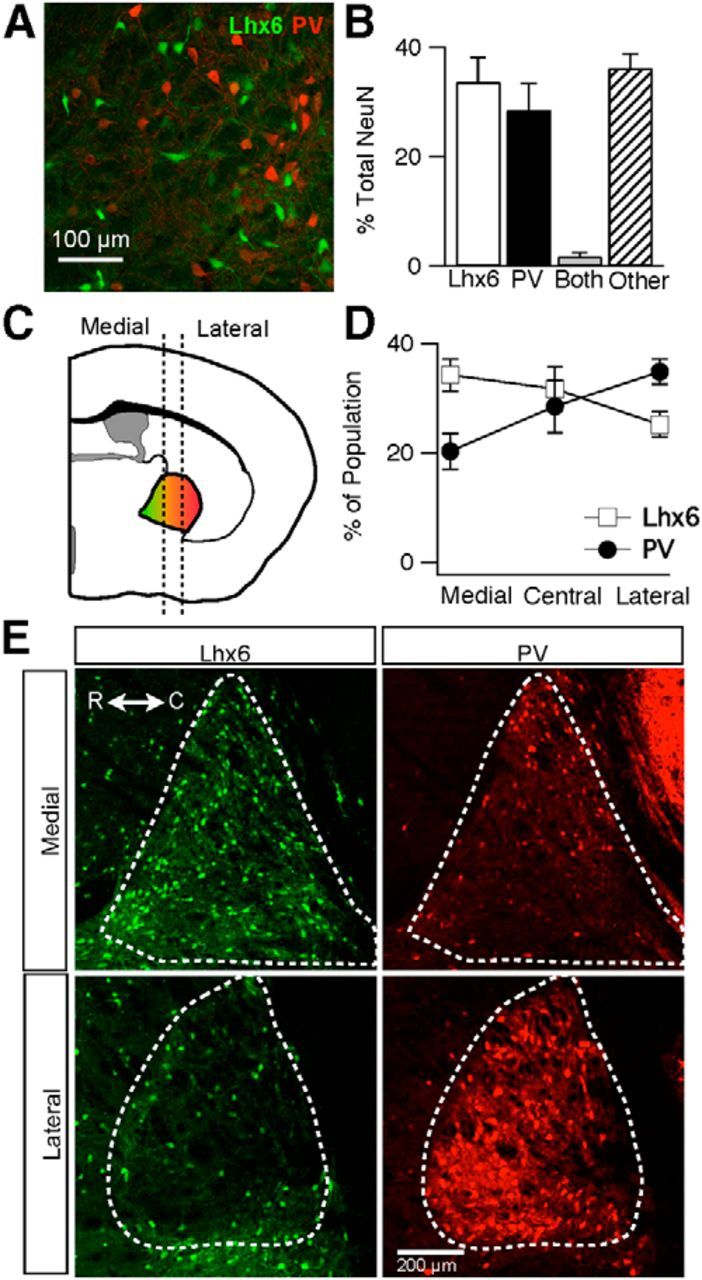
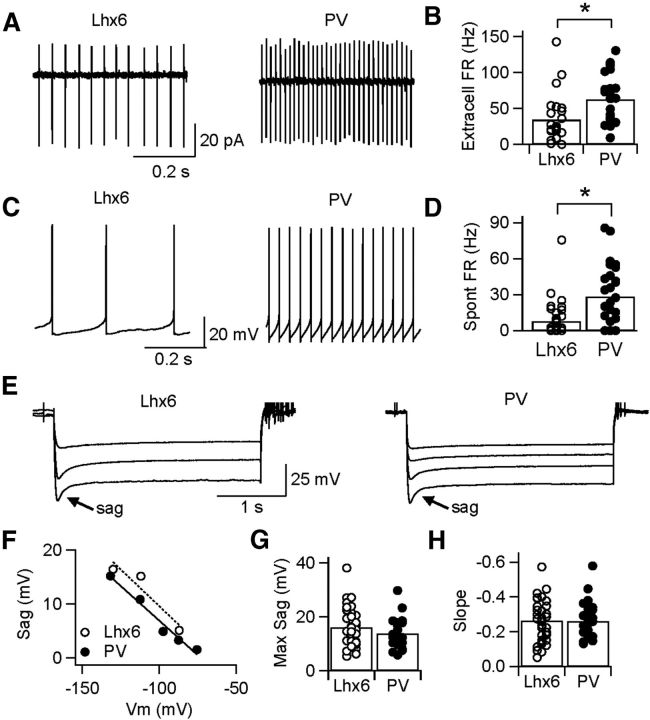
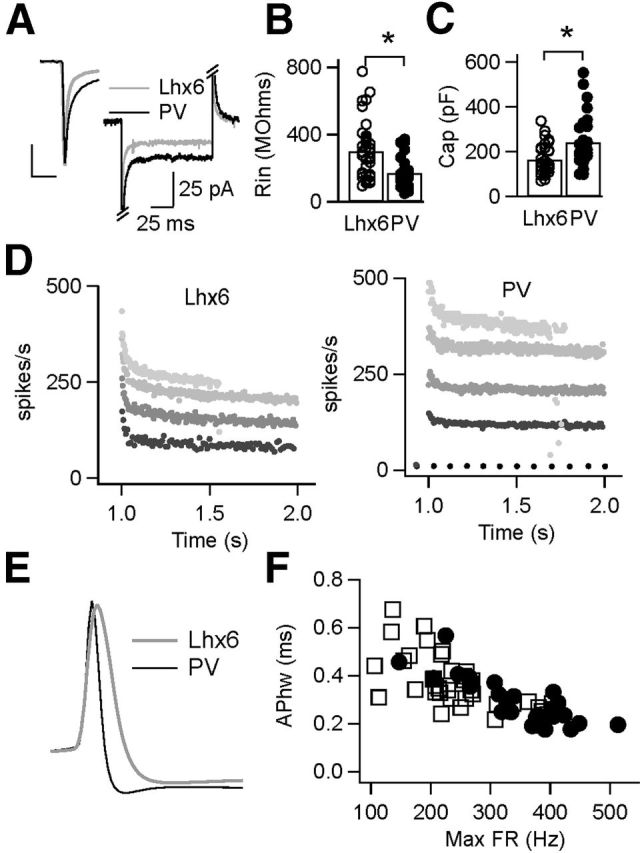
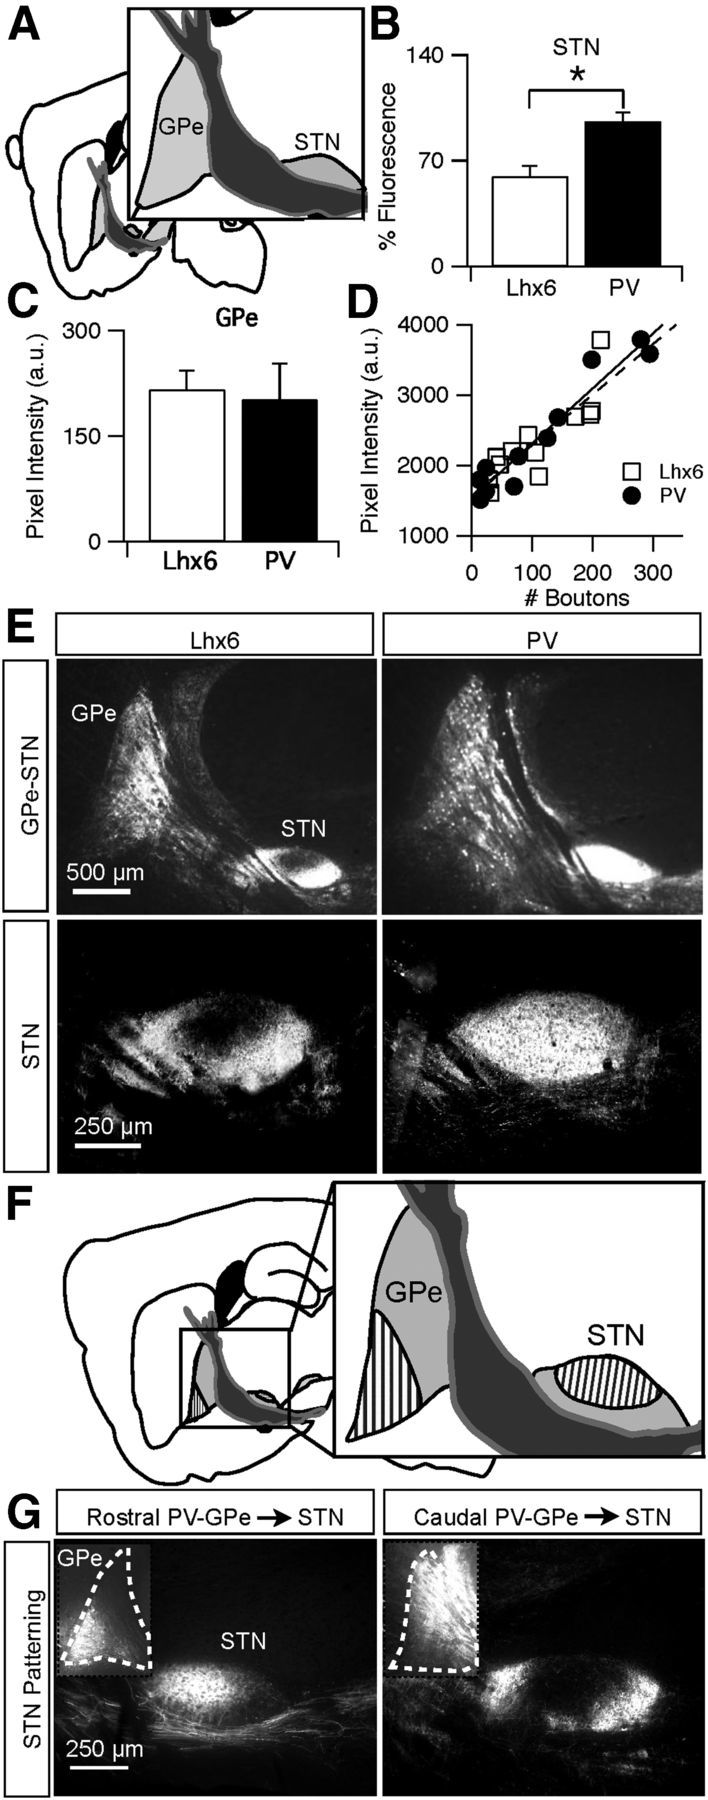
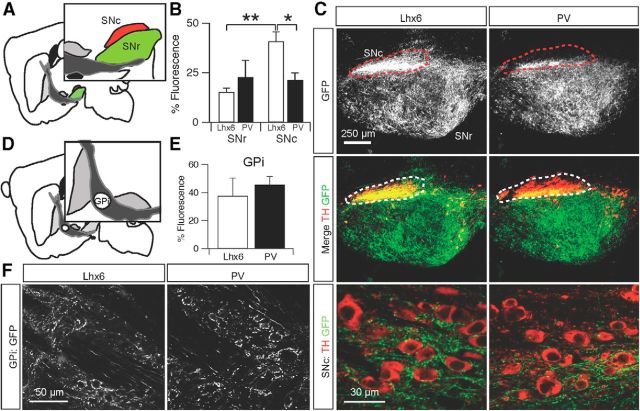
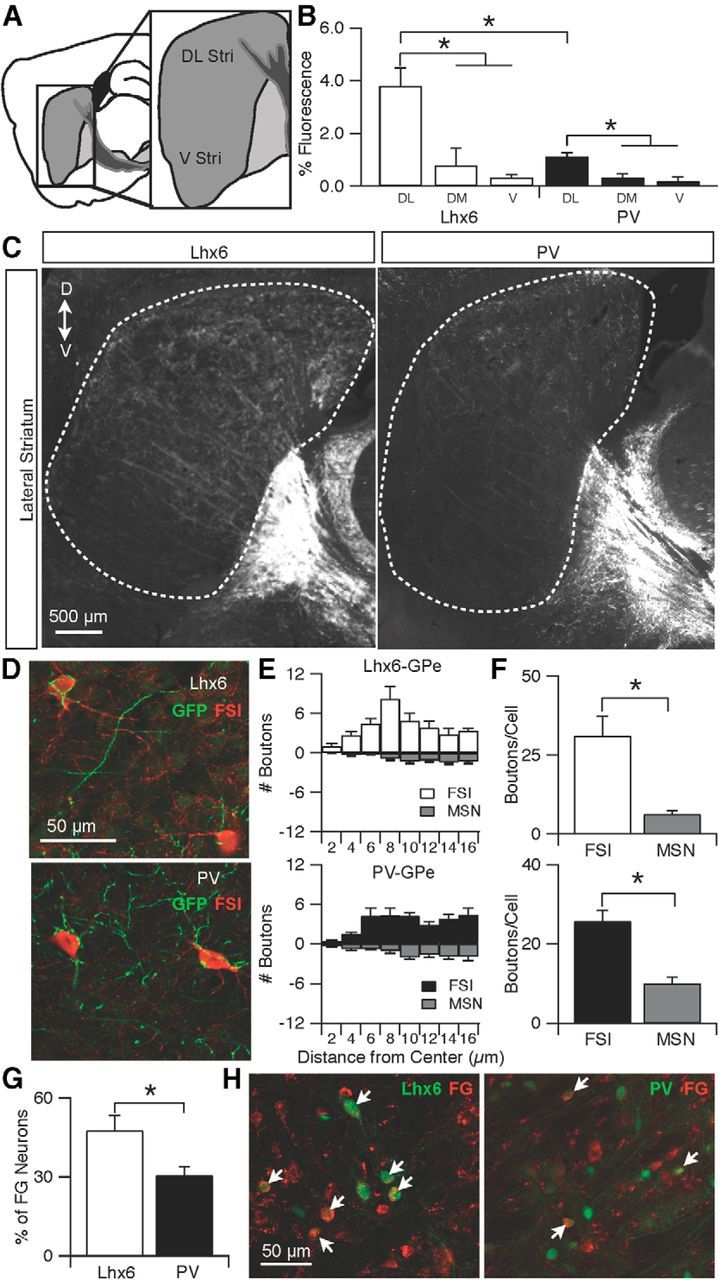
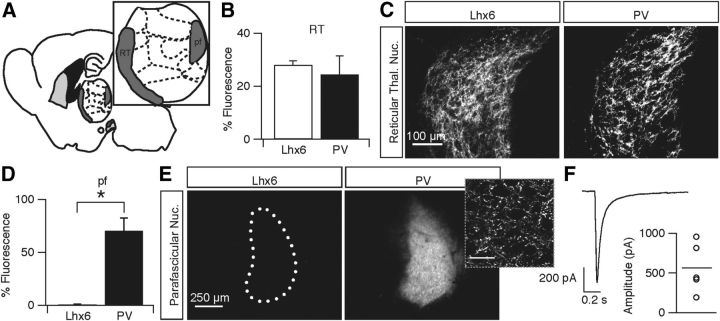
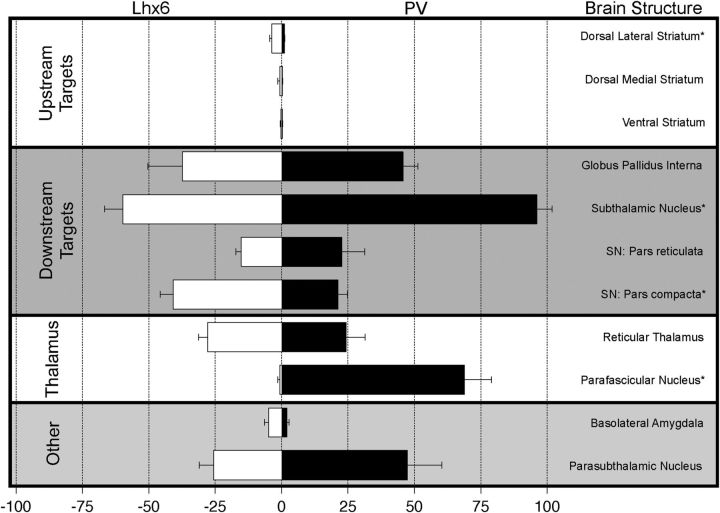
Cell-type diversity in the brain enables the assembly of complex neural circuits, whose organization and patterns of activity give rise to brain function. However, the identification of distinct neuronal populations within a given brain region is often complicated by a lack of objective criteria to distinguish one neuronal population from another. In the external segment of the globus pallidus (GPe), neuronal populations have been defined using molecular, anatomical, and electrophysiological criteria, but these classification schemes are often not generalizable across preparations and lack consistency even within the same preparation. Here, we present a novel use of existing transgenic mouse lines, Lim homeobox 6 (Lhx6)-Cre and parvalbumin (PV)-Cre, to define genetically distinct cell populations in the GPe that differ molecularly, anatomically, and electrophysiologically. Lhx6-GPe neurons, which do not express PV, are concentrated in the medial portion of the GPe. They have lower spontaneous firing rates, narrower dynamic ranges, and make stronger projections to the striatum and substantia nigra pars compacta compared with PV-GPe neurons. In contrast, PV-GPe neurons are more concentrated in the lateral portions of the GPe. They have narrower action potentials, deeper afterhyperpolarizations, and make stronger projections to the subthalamic nucleus and parafascicular nucleus of the thalamus. These electrophysiological and anatomical differences suggest that Lhx6-GPe and PV-GPe neurons participate in different circuits with the potential to contribute to different aspects of motor function and dysfunction in disease.

Keywords: basal ganglia; connectivity; globus pallidus; intrinsic excitability; transgenic mice.


Figures

Figure 1.
Figure 1.
Identification and distribution of Lhx6–GPe and PV–GPe neurons in transgenic mice. A, Epifluorescent image from the GPe of an Lhx6–GFP mouse immunostained for PV showing two distinct populations of Lhx6+/PV (green) and Lhx6/PV+ (red) neurons. B, Graph showing the percentage of neurons that are Lhx6+/PV, Lhx6/PV+, both, or other throughout the GPe. Error bars are SEM. C, Schematic depiction of cell-type gradient found along the mediolateral axis. Dotted lines divide the GPe into the three zones used for analysis of the mediolateral axis. The Lhx6 population (green) is found primarily in the medial portion, whereas PV population (red) is found more laterally. D, Graph of the percentage of each cell population located within the three divisions along the mediolateral axis. Error bars are SEM. E, Epifluorescent images of medial and lateral sections of the GPe showing Lhx6–GFP (green) or PV immunofluorescence (red). R, Rostral; C, caudal. Scale bar, 200 μm.
Figure 2.
Figure 2.
Differences in baseline firing rates of Lhx6–GPe and PV–GPe neurons. A, Representative traces of cell-attached recordings from Lhx6 (left) and PV (right) neurons, showing tonic firing with low interspike variability. B, Extracellular firing rates (FR) recorded for the population of PV–GPe neurons were significantly faster than those for Lhx6–GPe neurons. *p = 0.001. C, Representative traces of spontaneous firing in whole-cell recording configuration for Lhx6 (left) and PV (right) neurons. D, Spontaneous firing rates recorded for the population of PV–GPe neurons were significantly faster than those for Lhx6–GPe neurons. *p = 0.0003. E, Responses of representative Lhx6 (left) and PV (right) neurons to 3 s hyperpolarizing steps in current clamp. F, Amplitude of sag current plotted as a function of Vm reached immediately after the hyperpolarizing step for neurons in E. G, H, Maximum amplitude of the sag current (G) and its linear relationship to Vm (H), recorded for the population of Lhx6–GPe and PV–GPe neurons.
Figure 3.
Figure 3.
Differences in passive and active membrane properties of the Lhx6–GPe and PV–GPe neurons in slice recordings. A, Voltage-clamp recordings (Vhold = −80 mV) showing the response of representative Lhx6–GPe and PV–GPe neurons after a brief hyperpolarizing step (−5 mV, 100 ms). Inset shows the difference in membrane time constant (τ). Calibration: 100 pA, 2 ms. B, C, Population data showing significant differences in input resistance (Rin; B; *p = 0.0007) and whole-cell capacitance (Cap; C; *p = 0.002) between Lhx6–GPe and PV–GPe neurons. D, Instantaneous firing rates from representative Lhx6 (left) and PV (right) neurons in response to 1 s depolarizing current injections of increasing amplitude until neurons entered depolarization block. For Lhx6–GPe neurons, firing rates are shown in response to injections of 0 (no spikes), 200, 400, 800, and 1400 pA. For PV–GPe neurons, firing rates are shown in response to injections of 0, 400, 800, 1200, and 2700 pA. E, Average spike waveforms of representative Lhx6–GPe and PV–GPe neurons firing at 5–10 Hz. F, Scatter plot of AP width versus maximum firing rate (FR) for the population of Lhx6–GPe and PV–GPe neurons. These parameters varied continuously across the population but were significantly different between Lhx6–GPe and PV–GPe neurons.
Figure 4.
Figure 4.
PV–GPe neurons project more strongly to the STN than Lhx6–GPe neurons. A, Schematic of central sagittal plane used for analysis. B, Normalized fluorescence intensity of axons from Lhx6–GPe and PV–GPe neurons in the STN. *p = 0.006. Error bars are SEM. C, Fluorescence intensities measured in the GPe of Lhx6–Cre and PV–Cre mice 2 weeks after viral injections. Error bars are SD. D, Scatter plot showing a similar linear relationship between pixel intensity and bouton number within a 143 μm2 area of tissue, analyzed in brain areas receiving low, medium, and high densities of axonal innervation. E, EYFP fluorescence in Lhx6–Cre (left) and PV–Cre (right) mice 2 weeks after viral injections. Top, Magnification at 2.5× epifluorescent images displaying typical expression in the GPe and STN. Bottom, Magnification at 10× epifluorescent images from the central plane of analysis displaying fluorescence in the STN. F, Schematic of the topographic organization of PV–GPe projections from the rostral (striped) and caudal (solid) GPe to the STN. G, Representative examples of viral injections in the rostral (left) or caudal (right) GPe and their resulting projections onto the STN.
Figure 5.
Figure 5.
Lhx6–GPe and PV–GPe projections to basal ganglia output nuclei. A, Schematic of the central sagittal plane used for analysis and reference to the distinct areas of the SN: SNc (red) and SNr (green). B, Normalized fluorescence intensity of axons from Lhx6–GPe and PV–GPe neurons in the SNr and SNc. Lhx6–GPe neurons projected more densely to the SNc than PV–GPe neurons, and Lhx6 projections to the SNc were denser than those to the SNr. *p = 0.03; **p = 0.002. Error bars are SEM. C, Top, Epifluorescent images of axons from Lhx6–GPe and PV–GPe neurons in the SNr and SNc (outlined with dotted line). Middle, Overlay of GPe axons (green) and TH immunofluorescence (red). Bottom, Confocal images of Lhx6–GPe and PV–GPe axons (green) in the SNc; TH+ dopamine neurons are red. D, Schematic of GPi location within the internal capsule. E, Normalized fluorescence intensity of axons from Lhx6–GPe and PV–GPe neurons in the GPi. Error bars are SEM. F, Confocal images of Lhx6–GPe and PV–GPe axons in the GPi. Note that the GPi neurons did not express EYFP.
Figure 6.
Figure 6.
Lhx6–GPe neurons project more strongly to the dorsolateral striatum than PV–GPe neurons. A, Schematic of the sagittal plane used for analysis. DL Str, Dorsolateral striatum; V Str, ventral striatum. B, Normalized fluorescence intensity of axons from Lhx6–GPe and PV–GPe neurons to the dorsolateral striatum (DL), dorsomedial striatum (DM), and ventral striatum (V). Striatal projections from both cell types were significantly denser to the dorsolateral region than to the dorsomedial or ventral regions (Lhx6: DL vs DM, p = 0.020; DL vs V, p = 0.003; PV: DL vs DM, p = 0.006; DL vs V, p = 0.004); dorsolateral projections from Lhx6–GPe neurons were significantly denser than dorsolateral projections from PV–GPe neurons. Error bars are SEM. C, Epifluorescent images of axons from Lhx6–GPe and PV–GPe neurons in the striatum. D, Dorsal; V, ventral. D, Confocal images showing the selective innervation of Lhx6–GPe axons (top, green) or PV–GPe axons (bottom, green) onto striatal FSIs (red). E, Results of Sholl analysis. Number of boutons from Lhx6–GPe (top) or PV–GPe (bottom) neurons were counted in concentric circles of increasing diameter (2 μm) around striatal FSIs or MSNs. F, Bar graphs comparing total number of boutons onto FSIs or MSNs from Lhx6–GPe (top, *p = 0.001) or PV–GPe (bottom, *p = 0.0001) neurons. G, Bar graph showing the percentage of FG-labeled neurons that were either Lhx6+ or PV+. Significantly more FG neurons were Lhx6+ than were PV+ (*p = 0.003). H, Confocal images of the GPe in tissue from an Lhx6–GFP mouse, stained for PV and antibodies against FG. The Lhx6–GPe (left) and PV–GPe (right) neurons (green) showed colocalization with the retrograde tracer FG (red). Arrows indicate double-labeled neurons.
Figure 7.
Figure 7.
Lhx6–GPe and PV–GPe projections to the thalamus. A, Schematic of thalamic nuclei locations in a medial sagittal slice. B, Normalized fluorescence intensity of axons from Lhx6–GPe and PV–GPe neurons to the RT. There was no significant difference between the two populations. Error bars are SEM. C, Epifluorescent images of axons from Lhx6–GPe and PV–GPe neurons in the RT. D, Normalized fluorescence intensity of axons from Lhx6–GPe and PV–GPe neurons in the pf. Axons from Lhx6–GPe neurons were not observed in the pf. Error bars are SEM. *p = 0.0005. E, Epifluorescent images of axons from Lhx6–GPe and PV–GPe neurons in the pf. Inset, Confocal image of dense axonal innervation in the pf from PV–GPe neurons. Scale bar, 25 μm. F, IPSC recorded in a pf neuron in response to optical stimulation (1 ms) of ChR2-expressing PV–GPe axons. Graph shows IPSC amplitudes recorded from five pf neurons and the population average.
Figure 8.
Figure 8.
Summary of normalized fluorescence intensity of axons from Lhx6–GPe (white) and PV–GPe (black) neurons to identified brain structures. Error bars are SEM. Asterisks denote significance between cell types.

Similar articles

Cited by

References

    1. Albin RL, Young AB, Penney JB. The functional anatomy of basal ganglia disorders. Trends Neurosci. 1989;12:366–375. doi: 10.1016/0166-2236(89)90074-X. - DOI - PubMed
    1. Alexander GE, Crutcher MD. Functional architecture of basal ganglia circuits: neural substrates of parallel processing. Trends Neurosci. 1990;13:266–271. doi: 10.1016/0166-2236(90)90107-L. - DOI - PubMed
    1. Benhamou L, Bronfeld M, Bar-Gad I, Cohen D. Globus Pallidus external segment neuron classification in freely moving rats: a comparison to primates. PLoS One. 2012;7:e45421. doi: 10.1371/journal.pone.0045421. - DOI - PMC - PubMed
    1. Bergman H, Wichmann T, Karmon B, DeLong MR. The primate subthalamic nucleus. II. Neuronal activity in the MPTP model of parkinsonism. J Neurophysiol. 1994;72:507–520. - PubMed
    1. Bergman H, Feingold A, Nini A, Raz A, Slovin H, Abeles M, Vaadia E. Physiological aspects of information processing in the basal ganglia of normal and parkinsonian primates. Trends Neurosci. 1998;21:32–38. doi: 10.1016/S0166-2236(97)01151-X. - DOI - PubMed

Publication types