

Enhancers are major targets for murine leukemia virus vector integration
- PMID: 24501411
- PMCID: PMC3993722
- DOI: 10.1128/JVI.00011-14
Enhancers are major targets for murine leukemia virus vector integration
Abstract
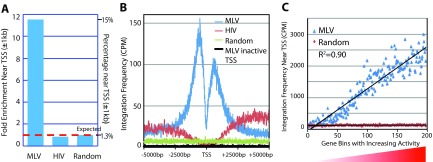
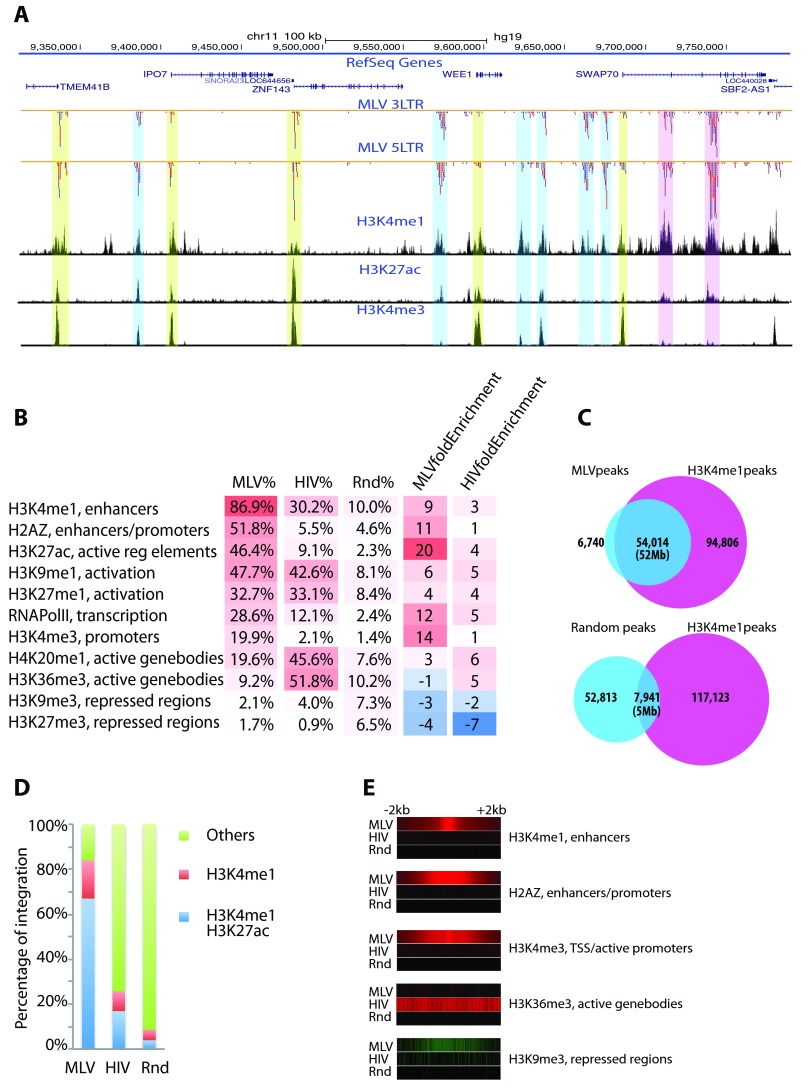
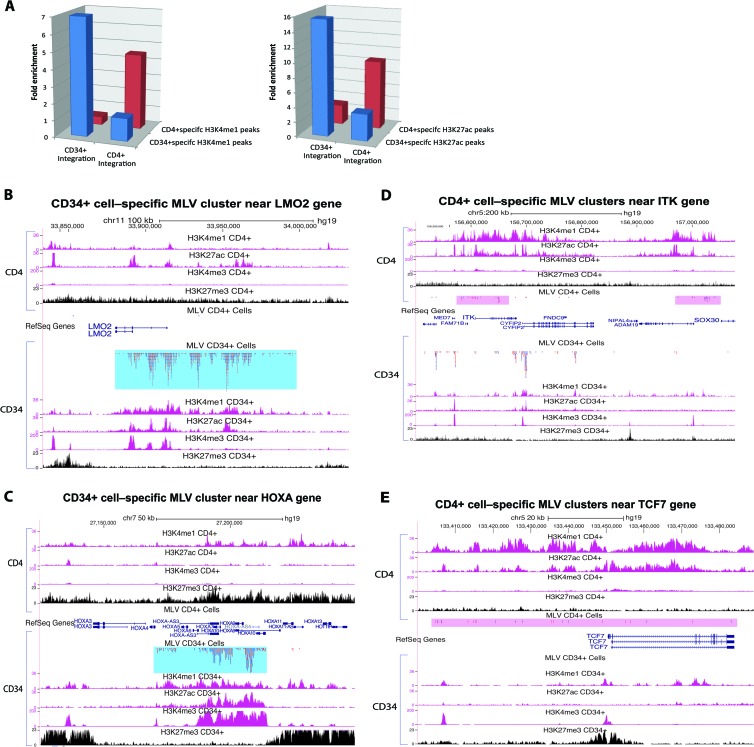
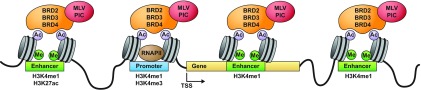
Retroviral vectors have been used in successful gene therapies. However, in some patients, insertional mutagenesis led to leukemia or myelodysplasia. Both the strong promoter/enhancer elements in the long terminal repeats (LTRs) of murine leukemia virus (MLV)-based vectors and the vector-specific integration site preferences played an important role in these adverse clinical events. MLV integration is known to prefer regions in or near transcription start sites (TSS). Recently, BET family proteins were shown to be the major cellular proteins responsible for targeting MLV integration. Although MLV integration sites are significantly enriched at TSS, only a small fraction of the MLV integration sites (<15%) occur in this region. To resolve this apparent discrepancy, we created a high-resolution genome-wide integration map of more than one million integration sites from CD34(+) hematopoietic stem cells transduced with a clinically relevant MLV-based vector. The integration sites form ∼60,000 tight clusters. These clusters comprise ∼1.9% of the genome. The vast majority (87%) of the integration sites are located within histone H3K4me1 islands, a hallmark of enhancers. The majority of these clusters also have H3K27ac histone modifications, which mark active enhancers. The enhancers of some oncogenes, including LMO2, are highly preferred targets for integration without in vivo selection.
Importance: We show that active enhancer regions are the major targets for MLV integration; this means that MLV preferentially integrates in regions that are favorable for viral gene expression in a variety of cell types. The results provide insights for MLV integration target site selection and also explain the high risk of insertional mutagenesis that is associated with gene therapy trials using MLV vectors.
Figures
Similar articles
-
Deletion of the LTR enhancer/promoter has no impact on the integration profile of MLV vectors in human hematopoietic progenitors.PLoS One. 2013;8(1):e55721. doi: 10.1371/journal.pone.0055721. Epub 2013 Jan 31. PLoS One. 2013. PMID: 23383272 Free PMC article.
-
BET-Independent Murine Leukemia Virus Integration Is Retargeted In Vivo and Selects Distinct Genomic Elements for Lymphomagenesis.Microbiol Spectr. 2022 Aug 31;10(4):e0147822. doi: 10.1128/spectrum.01478-22. Epub 2022 Jul 19. Microbiol Spectr. 2022. PMID: 35852337 Free PMC article.
-
Novel principles of gamma-retroviral insertional transcription activation in murine leukemia virus-induced end-stage tumors.Retrovirology. 2014 May 19;11:36. doi: 10.1186/1742-4690-11-36. Retrovirology. 2014. PMID: 24886479 Free PMC article.
-
Stem cell gene transfer: insights into integration and hematopoiesis from primate genetic marking studies.Ann N Y Acad Sci. 2005 Jun;1044:178-82. doi: 10.1196/annals.1349.023. Ann N Y Acad Sci. 2005. PMID: 15958711 Review.
-
Prospects for gene therapy using HIV-based vectors.Somat Cell Mol Genet. 2001 Nov;26(1-6):159-74. doi: 10.1023/a:1021034931852. Somat Cell Mol Genet. 2001. PMID: 12465467 Review.
Cited by
-
Structural and sequencing analysis of local target DNA recognition by MLV integrase.Nucleic Acids Res. 2015 Jun 23;43(11):5647-63. doi: 10.1093/nar/gkv410. Epub 2015 May 12. Nucleic Acids Res. 2015. PMID: 25969444 Free PMC article.
-
Cellular and molecular mechanisms of HIV-1 integration targeting.Cell Mol Life Sci. 2018 Jul;75(14):2491-2507. doi: 10.1007/s00018-018-2772-5. Epub 2018 Feb 7. Cell Mol Life Sci. 2018. PMID: 29417178 Free PMC article. Review.
-
Efficient Non-viral Gene Delivery into Human Hematopoietic Stem Cells by Minicircle Sleeping Beauty Transposon Vectors.Mol Ther. 2018 Apr 4;26(4):1137-1153. doi: 10.1016/j.ymthe.2018.01.012. Epub 2018 Jan 31. Mol Ther. 2018. PMID: 29503198 Free PMC article.
-
Structure and function of retroviral integrase.Nat Rev Microbiol. 2022 Jan;20(1):20-34. doi: 10.1038/s41579-021-00586-9. Epub 2021 Jul 9. Nat Rev Microbiol. 2022. PMID: 34244677 Free PMC article. Review.
-
Dynamic Transcriptional and Epigenetic Regulation of Human Epidermal Keratinocyte Differentiation.Stem Cell Reports. 2016 Apr 12;6(4):618-632. doi: 10.1016/j.stemcr.2016.03.003. Epub 2016 Mar 31. Stem Cell Reports. 2016. PMID: 27050947 Free PMC article.
References
-
- Hacein-Bey-Abina S, Garrigue A, Wang GP, Soulier J, Lim A, Morillon E, Clappier E, Caccavelli L, Delabesse E, Beldjord K, Asnafi V, MacIntyre E, Dal Cortivo L, Radford I, Brousse N, Sigaux F, Moshous D, Hauer J, Borkhardt A, Belohradsky BH, Wintergerst U, Velez MC, Leiva L, Sorensen R, Wulffraat N, Blanche S, Bushman FD, Fischer A, Cavazzana-Calvo M. 2008. Insertional oncogenesis in 4 patients after retrovirus-mediated gene therapy of SCID-X1. J. Clin. Investig. 118:3132–3142. 10.1172/JCI35700 - DOI - PMC - PubMed
-
- Howe SJ, Mansour MR, Schwarzwaelder K, Bartholomae C, Hubank M, Kempski H, Brugman MH, Pike-Overzet K, Chatters SJ, de Ridder D, Gilmour KC, Adams S, Thornhill SI, Parsley KL, Staal FJ, Gale RE, Linch DC, Bayford J, Brown L, Quaye M, Kinnon C, Ancliff P, Webb DK, Schmidt M, von Kalle C, Gaspar HB, Thrasher AJ. 2008. Insertional mutagenesis combined with acquired somatic mutations causes leukemogenesis following gene therapy of SCID-X1 patients. J. Clin. Investig. 118:3143–3150. 10.1172/JCI35798 - DOI - PMC - PubMed
-
- Witzel MGW, Braun CJ, Boztug K, Paruzynski A, Albert MH, Schwarzer A, Modlich U, Beier R, Göhring G, Naundorf S, Kühlcke K, Rose M, Fraser C, Mathias L, Ferrari R, Abboud MR, Al-Herz W, Kondratenko I, Maródi L, Schlegelberger B, Baum C, Schmidt M, von Kalle C, Klein C. 2013. Hematopoietic stem cell gene therapy for Wiskott-Aldrich syndrome. Blood 122:718 http://bloodjournal.hematologylibrary.org/content/122/21/718.abstract
-
- Ott MG, Schmidt M, Schwarzwaelder K, Stein S, Siler U, Koehl U, Glimm H, Kuhlcke K, Schilz A, Kunkel H, Naundorf S, Brinkmann A, Deichmann A, Fischer M, Ball C, Pilz I, Dunbar C, Du Y, Jenkins NA, Copeland NG, Luthi U, Hassan M, Thrasher AJ, Hoelzer D, von Kalle C, Seger R, Grez M. 2006. Correction of X-linked chronic granulomatous disease by gene therapy, augmented by insertional activation of MDS1-EVI1, PRDM16 or SETBP1. Nat. Med. 12:401–409. 10.1038/nm1393 - DOI - PubMed
Publication types
MeSH terms
Substances
Grants and funding
LinkOut - more resources
Full Text Sources
Other Literature Sources
