Review
. 2013 Dec 4:2:447.
doi: 10.1038/bonekey.2013.181. eCollection 2013.

Bone composition: relationship to bone fragility and antiosteoporotic drug effects

Affiliations
Review

Bone composition: relationship to bone fragility and antiosteoporotic drug effects

Adele L Boskey. Bonekey Rep. .

Erratum in

Abstract

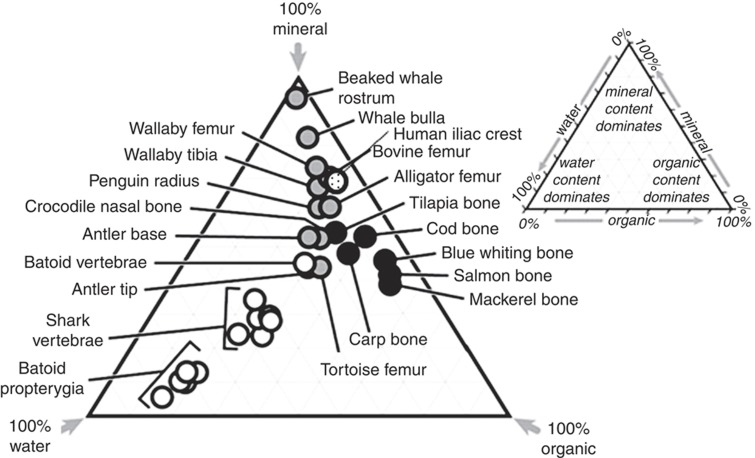
The composition of a bone can be described in terms of the mineral phase, hydroxyapatite, the organic phase, which consists of collagen type I, noncollagenous proteins, other components and water. The relative proportions of these various components vary with age, site, gender, disease and treatment. Any drug therapy could change the composition of a bone. This review, however, will only address those pharmaceuticals used to treat or prevent diseases of bone: fragility fractures in particular, and the way they can alter the composition. As bone is a heterogeneous tissue, its composition must be discussed in terms of the chemical makeup, properties of its chemical constituents and their distributions in the ever-changing bone matrix. Emphasis, in this review, is placed on changes in composition as a function of age and various diseases of bone, particularly osteoporosis. It is suggested that while some of the antiosteoporotic drugs can and do modify composition, their positive effects on bone strength may be balanced by negative ones.


Conflict of interest statement

Dr Boskey's work on FTIRI and osteoporosis has been funded by the NIH. The author declares no conflict of interest.

Figures

Figure 1
Figure 1
Bone composition. Ternary diagram illustrating the composition of mature bones in different species (adapted from Currey J.D. ‘Bones'. Princeton University Press: Princeton, NJ, 2002, p 436.) and reproduced with permission from Journal of Experimental Biologists, Figure 7B in ‘Comparison of structural, architectural and mechanical aspects of cellular and acellular bone in two teleost fish'. The speckled circle is the average of data from five iliac crest biopsies of females aged 69–75 years.
Figure 2
Figure 2
BMDD distribution of bone. Measurement of bone mineralization density distribution (BMDD) using quantitative backscattered electron imaging (qBEI) in a transiliac bone biopsy sample (left insert) from a 39-year-old women with coeliac disease (PATIENT). The qBEI image shows a detail of the cancellous bone compartment. Bright gray levels mean high and dark gray levels mean low mineral content. The trabecular features display severe under mineralization and mineralization defects. Thus, the BMDD curve is extremely shifted to the left toward lower matrix mineralization (decreased CaMean, CaPeak, CaHigh and increased CaLow) compared with the normal reference BMDD (Ref.). In addition, the peak width of the BMDD (CaWidth) is distinctly enlarged, indicating an enormous heterogeneity in mineralization of the bone matrix. Examinations by histological staining techniques revealed a severe osteomalacia combined with signs of secondary hyperparathyroidism. Description of the individual BMDD indices derived from the BMDD curve: *CaMean, the weighted mean calcium concentration of the bone area obtained by the integrated area under the BMDD curve; *CaPeak, the peak position of the histogram, which indicates the most frequently occurring calcium concentration (mode calcium concentration); *CaWidth, the full-width at half-maximum of the distribution, describing the variation in mineralization density (heterogeneity); *CaLow, the percentage of bone area that is mineralized below the 5th percentile of the reference BMDD of normal adults, that is, below 17.68 weight percent calcium. This parameter corresponds normally to the amount of bone area undergoing primary mineralization. *CaHigh, the percentage of bone area that is mineralized above the 95th percentile of the reference BMDD of normal adults that is above 25.30 weight percent calcium. This parameter corresponds to bone matrix having achieved plateau level of normal mineralization. Figures courtesy of P Roschger.
Figure 3
Figure 3
FTIRI images. Typical FTIR images of mineral compositional parameters in normal and osteoporotic bone trabeculae from iliac crest biopsies of a woman with fractures and her age-matched control. Left side, normal; right side, osteoporotic (fractured). Images are shown for: mineral/matrix ratio, carbonate/phosphate ratio, crystallinity (1030/1020, cm−1) and acid phosphate substitution. The arrow indicates the size scale for all images. The color scales for each parameter for both normal and fractured images are shown.
Figure 4
Figure 4
Raman analysis. (a) Image as seen under the Raman microscope showing the double tetracycline labels used to define newly formed trabecular bone, the three areas examined are shown. (b) Typical Raman spectra of bone from a premenopausal woman and a woman with osteoporosis. (c) Mean values for the indicated parameters calculated from the Raman spectra of these two patients. Figure courtesy of Dr Lefteris Paschalis.
Figure 5
Figure 5
FTIR image of the organic matrix in osteoporosis. Typical cortical bone image of collagen maturity (ratio of intensity of 1660/1690, cm−1) in iliac crest biopsies from age-matched women without and with a fracture. The magnification is indicated by the arrow. The infrared spectra corresponding to the pixel at the tip of the arrow is shown. The major peaks used in the analysis of mineral and matrix are indicated in this figure.
Figure 6
Figure 6
Compositional changes in bone as detected by Raman and FTIRI. Top row of figures show Raman compositional data indicating changes from baseline in newly formed trabecular bone caused by 1 year treatment with teriparatide (TP) following longer treatment with alendronate (ALN) or risedronate (RIS). Differences between baseline and TP treatment are indicated. Mineral-to-matrix, inverse of crystallinity and proteoglycan-to-mineral ratios are shown (adapted with permission from Figures 2a, 3 and 4 in Gamsjaeger et al.. Lower row shows FTIRI lack of compositional changes in iliac crest biopsies from a group of 48 women, half with fractures and half without who had comparable hip BMD values. The first figure shows mean and standard deviation in cancellous bone. The second figure illustrates the mean and standard deviation of the heterogeneity of these parameters. *P<0.05.
Figure 7
Figure 7
Water distribution in midshaft tibia cortical bone is demonstrated by three-dimensional ultrashort echo-time magnetic resonance imaging. (a) A young 33-year-old woman without osteoporosis, and (b) is a 64-year-old woman. Note the marked increase in bone water content (BWC) shown by both the concentration images (on the top) and their histograms (c and d, respectively, on the bottom) (reproduced from Yoder et al. (Figure 5) with permission from John Wiley & Sons Ltd).

References

    1. Boskey A. Mineralization of bones and teeth. Elements Mag 2007;3:385–392.
    1. Young MF. Bone matrix proteins: their function, regulation, and relationship to osteoporosis. Osteoporos Int 2003;14:S35–S42. - PubMed
    1. Boskey AL, Coleman R. Aging and bone. J Dent Res 2010;89:1333–1348. - PMC - PubMed
    1. Donnelly E, Meredith DS, Nguyen JT, Boskey AL. Bone tissue composition varies across anatomic sites in the proximal femur and the iliac crest. J Orthop Res 2012;30:700–706. - PMC - PubMed
    1. Gregson CL, Paggiosi MA, Crabtree N, Steel SA, McCloskey E, Duncan EL et al.. Analysis of body composition in individuals with high bone mass reveals a marked increase in fat mass in women but not men. J Clin Endocrinol Metab 2013;98:818–828. - PMC - PubMed