. 2014 Feb 6;7(1):21.
doi: 10.1186/1754-6834-7-21.

Transcriptomic response to prolonged ethanol production in the cyanobacterium Synechocystis sp. PCC6803

Affiliations

Transcriptomic response to prolonged ethanol production in the cyanobacterium Synechocystis sp. PCC6803

Dennis Dienst et al. Biotechnol Biofuels. .

Abstract

Background: The production of biofuels in photosynthetic microalgae and cyanobacteria is a promising alternative to the generation of fuels from fossil resources. To be economically competitive, producer strains need to be established that synthesize the targeted product at high yield and over a long time. Engineering cyanobacteria into forced fuel producers should considerably interfere with overall cell homeostasis, which in turn might counteract productivity and sustainability of the process. Therefore, in-depth characterization of the cellular response upon long-term production is of high interest for the targeted improvement of a desired strain.

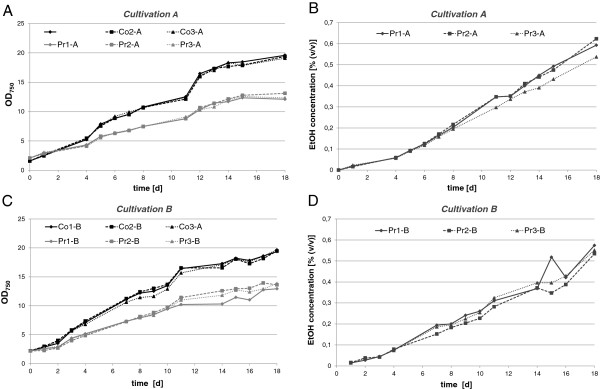
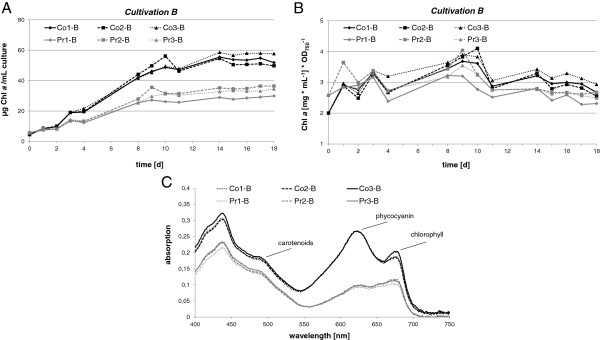
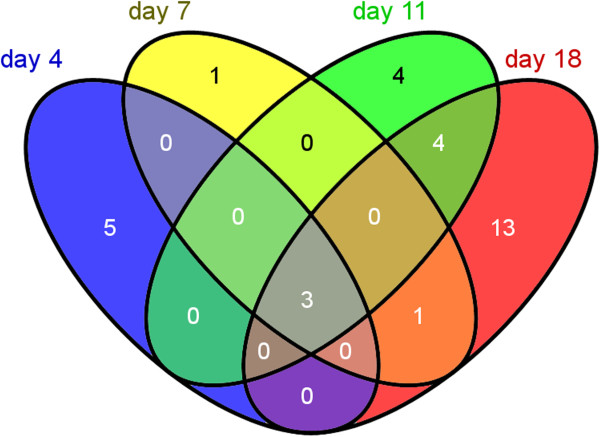
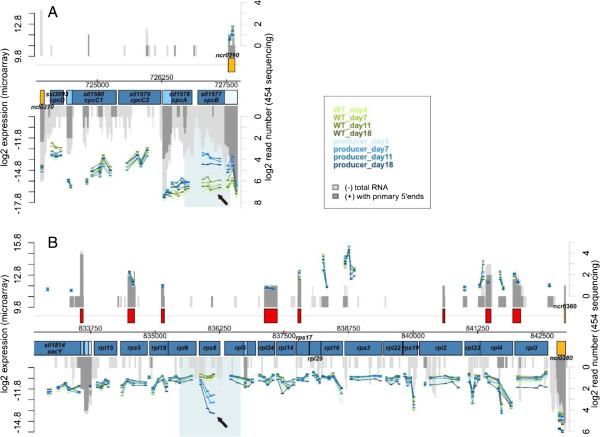
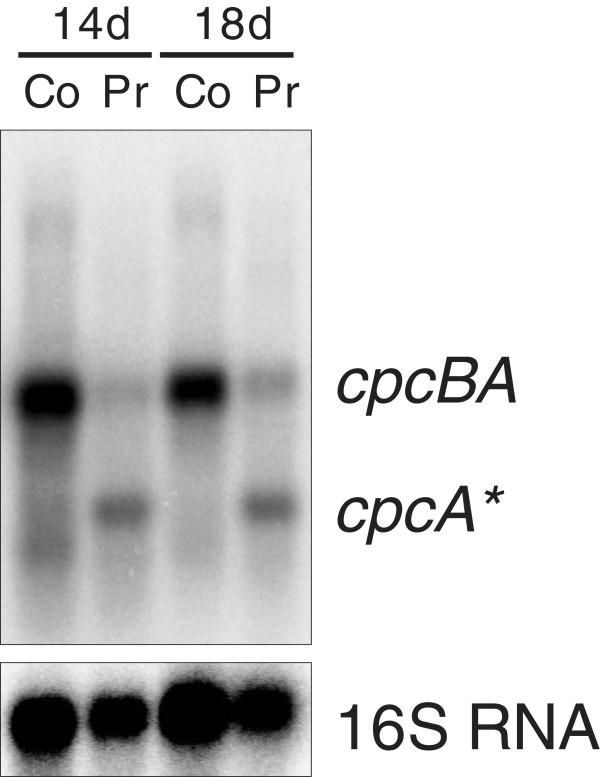
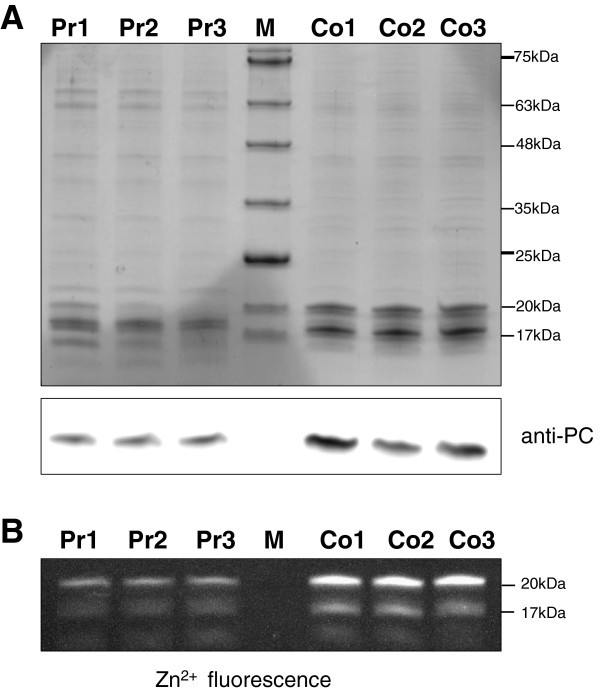
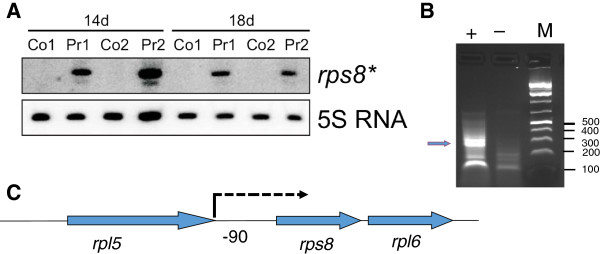
Results: The transcriptome-wide response to continuous ethanol production was examined in Synechocystis sp. PCC6803 using high resolution microarrays. In two independent experiments, ethanol production rates of 0.0338% (v/v) ethanol d-1 and 0.0303% (v/v) ethanol d-1 were obtained over 18 consecutive days, measuring two sets of biological triplicates in fully automated photobioreactors. Ethanol production caused a significant (~40%) delay in biomass accumulation, the development of a bleaching phenotype and a down-regulation of light harvesting capacity. However, microarray analyses performed at day 4, 7, 11 and 18 of the experiment revealed only three mRNAs with a strongly modified accumulation level throughout the course of the experiment. In addition to the overexpressed adhA (slr1192) gene, this was an approximately 4 fold reduction in cpcB (sll1577) and 3 to 6 fold increase in rps8 (sll1809) mRNA levels. Much weaker modifications of expression level or modifications restricted to day 18 of the experiment were observed for genes involved in carbon assimilation (Ribulose bisphosphate carboxylase and Glutamate decarboxylase). Molecular analysis of the reduced cpcB levels revealed a post-transcriptional processing of the cpcBA operon mRNA leaving a truncated mRNA cpcA* likely not competent for translation. Moreover, western blots and zinc-enhanced bilin fluorescence blots confirmed a severe reduction in the amounts of both phycocyanin subunits, explaining the cause of the bleaching phenotype.

Conclusions: Changes in gene expression upon induction of long-term ethanol production in Synechocystis sp. PCC6803 are highly specific. In particular, we did not observe a comprehensive stress response as might have been expected.


Figures

Figure 1
Figure 1
Growth and ethanol production of an ethanologenic Synechocystis 6803 strain (Pr) compared to the empty vector control strain (Co) over a period of 18 days in two independent cultivation experiments, A and B, and in three biological replicates each. (A) Growth curves of triplicate cultures during cultivation A. At time points 4 d, 7 d, 11 d and 18 d, samples were taken for RNA preparation and transcriptome analysis. (B) Accumulation of ethanol in the producer strain (Pr) during cultivation A in three biological replicates. (C) Growth curves of triplicate cultures during cultivation B. At time points 14 d and 18 d, samples were taken for northern and immunoblot analysis. (D) Accumulation of ethanol in the Pr during cultivation B in three biological replicates. Growth during cultivation A: Co, 1.08 ± 0.017 optical density (OD) units d-1; Pr, 0.65 ± 0.021 OD units d-1. Growth during cultivation B: Co, 1.06 ± 0.010 OD units d-1; Pr, 0.66 ± 0.085 OD units d-1. Production during cultivation A: Pr, 0.0338 ± 0.002% ethanol (EtOH) d-1. Production during cultivation B: Pr, 0.0303 ± 0.002% EtOH d-1.
Figure 2
Figure 2
Pigment content of ethanol producer (Pr) compared to isogenic empty vector control strain (Co) from cultivation B in three biological replicates. (A) Chlorophyll content; (B) ratio between chlorophyll and optical density (OD)750 for each triplicate; (C) representative whole-cell absorption spectra at day 18 of the experiment.
Figure 3
Figure 3
Overlaps between significantly regulated (log2 fold change >0.7 between control and producer strain) mRNAs between the four time points. The numbers of mRNAs are indicated. Only the transcripts of adhA, rps8 and cpcB (center) showed significantly altered levels at all time points. Further details are listed in Table 1. The complete set of microarray data is presented in Additional file 1.
Figure 4
Figure 4
Detail of gene expression analysis (microarrays) in Synechocystis 6803 producer and isogenic control strains (wild type) 4 days (time point t1), 7 days (t2), 11 days (t3) and 18 days (t4) after start of the experiment. (A) The genome section containing the phycocyanin operon cpcBAC2C1D is shown. The location of annotated genes is indicated by the blue boxes. The numbers of RNAseq reads from previous transcriptome analyses under standard conditions [11] are plotted for comparison (dark grey, primary reads; light grey, secondary reads). The normalized log2 expression values obtained by microarray analyses (normalized expression of biological duplicates A1 and A2 in two technical duplicates each) are plotted for each probe as bars in blue (producer A1 and A2, with increasing colour intensity from to to t4) or green (control incubation, with increasing colour intensity from to to t4). The scale for the microarray data is given at the left y-axis. Under ethanol biosynthesis conditions, cpcB– related transcripts decrease in abundance (black arrow). (B) Genome section containing the ribosomal protein operon (genes rpl3-4-23-2-rps19-rpl22-rps3-rpl16-29-rps17-rpl14-24-5-rps8-rpl6-18-rps5-rpl15). Under ethanol biosynthesis conditions, rps8–related transcripts increase as indicated by the arrow. WT, wild type.
Figure 5
Figure 5
Differential accumulation of the transcripts cpcBA and cpcA* in the ethanol producer (Pr) and non-producer control strains (Co) of Synechocystis 6803, after 14 or 18 days of cultivation in Crison photobioreactors. For loading control, blots were hybridized with a probe against the 16S rRNA.
Figure 6
Figure 6
Reduced accumulation of α phycocyanin in the producer (Pr1-3) in comparison to the control strain (Co1-3). (A) Soluble protein extract (3 μg) from three replicate cultures for each strain were separated using a 16% Tricine-SDS polyacrylamide gel containing urea (upper panel) and subjected to western blot analysis (lower panel) using a phycocyanin-specific antibody [16]. (B) Zinc fluorescence of covalently attached bilins visualized on a UV transilluminator in a 16% Tricine-SDS gel. Molecular masses inferred from protein marker VI, (M; AppliChem, Darmstadt, Germany) are shown on the right. The samples were prepared at day 14 of the experiment.
Figure 7
Figure 7
Accumulation of rps8*, an internal transcript within the rps8/spc operon covering part of the rps8 gene and the rpl5-rps8 intergenic spacer. (A) Accumulation of rps8* in the ethanol producer (Pr1 and Pr2) but not in the control strain (Co1 and Co2) after 14 and 18 days of cultivation in Crison photobioreactors. Total RNA was isolated from duplicate cultures, blotted and hybridized with a strand-specific RNA probe antisense to the rps8 sequence. For loading control, blots were hybridized with a probe against the 5S rRNA. (B) 5′RACE mapping of rps8* 5′ ends revealed an initiation of transcription 91 to 96 nt upstream of the rps8 start codon; plus sign (+) indicates treatment of RNA samples with tobacco acid pyrophosphatase; minus sign (−) indicates mock treatment. The bands excised for cloning and sequence analysis is indicated by the arrow. (C) Location of rps8* (arrow) within the rps8/spc operon.

References

    1. McKinlay JB, Harwood CS. Photobiological production of hydrogen gas as a biofuel. Curr Opin Biotechnol. 2010;21:244–251. doi: 10.1016/j.copbio.2010.02.012. - DOI - PubMed
    1. Deng MD, Coleman JR. Ethanol synthesis by genetic engineering in cyanobacteria. Appl Environ Microbiol. 1999;65:523–528. - PMC - PubMed
    1. Atsumi S, Higashide W, Liao JC. Direct photosynthetic recycling of carbon dioxide to isobutyraldehyde. Nat Biotechnol. 2009;27:1177–1180. doi: 10.1038/nbt.1586. - DOI - PubMed
    1. Takahama K, Matsuoka M, Nagahama K, Ogawa T. Construction and analysis of a recombinant cyanobacterium expressing a chromosomally inserted gene for an ethylene-forming enzyme at the psbAI locus. J Biosci Bioeng. 2003;95:302–305. doi: 10.1016/S1389-1723(03)80034-8. - DOI - PubMed
    1. Lindberg P, Park S, Melis A. Engineering a platform for photosynthetic isoprene production in cyanobacteria, using Synechocystis as the model organism. Metab Eng. 2010;12:70–79. doi: 10.1016/j.ymben.2009.10.001. - DOI - PubMed