. 2014 Apr;6(4):467-81.
doi: 10.1002/emmm.201302698. Epub 2014 Feb 6.

Nuclear translocation of FGFR1 and FGF2 in pancreatic stellate cells facilitates pancreatic cancer cell invasion

Affiliations

Nuclear translocation of FGFR1 and FGF2 in pancreatic stellate cells facilitates pancreatic cancer cell invasion

Stacey J Coleman et al. EMBO Mol Med. 2014 Apr.

Abstract

Pancreatic cancer is characterised by desmoplasia, driven by activated pancreatic stellate cells (PSCs). Over-expression of FGFs and their receptors is a feature of pancreatic cancer and correlates with poor prognosis, but whether their expression impacts on PSCs is unclear. At the invasive front of human pancreatic cancer, FGF2 and FGFR1 localise to the nucleus in activated PSCs but not cancer cells. In vitro, inhibiting FGFR1 and FGF2 in PSCs, using RNAi or chemical inhibition, resulted in significantly reduced cell proliferation, which was not seen in cancer cells. In physiomimetic organotypic co-cultures, FGFR inhibition prevented PSC as well as cancer cell invasion. FGFR inhibition resulted in cytoplasmic localisation of FGFR1 and FGF2, in contrast to vehicle-treated conditions where PSCs with nuclear FGFR1 and FGF2 led cancer cells to invade the underlying extra-cellular matrix. Strikingly, abrogation of nuclear FGFR1 and FGF2 in PSCs abolished cancer cell invasion. These findings suggest a novel therapeutic approach, where preventing nuclear FGF/FGFR mediated proliferation and invasion in PSCs leads to disruption of the tumour microenvironment, preventing pancreatic cancer cell invasion.


Figures
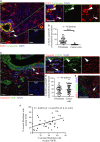
Figure 1
Figure 1
FGF2 and FGFR1 localise to the nucleus of fibroblasts in human PDAC tissues.
  1. Pancreatic cancer tissue showed cytokeratin positive (green, arrowhead) epithelial tumour cells with cytoplasmic FGF2 (red); however, cytokeratin negative stromal cells with fibroblastic morphology (arrow) showed nuclear FGF2 staining (red), demonstrated clearly in the side panel. DAPI stains the nuclei. Inset box shows IgG control.

  2. FGF2 and DAPI pixel co-localisation analysis (of 46 patients, at least one TMA core analysed per patient) performed by confocal microscopy (See Supplementary Fig 1 and Methods) confirmed the presence of nuclear FGF2 in 35% of stromal cells but not in tumour cells. ***P < 0.0001, Mann–Whitney U-test (B, D). Data summary represented by median ± interquartile range.

  3. Similarly, FGFR1 (green) was present in the nuclei of fibroblasts, as identified by vimentin expression (red, arrow). Vimentin negative cells with epithelial, glandular morphology showed cytoplasmic and nuclear FGFR1 (arrow head) as shown in side panel consistent with A. Inset box shows IgG control.

  4. FGFR1 and DAPI pixel co-localisation analysis performed (of 46 patients, at least one TMA core analysed per patient) by confocal microscopy, as above, confirmed presence of nuclear FGFR1 in 37% of stromal cells and 39% of cancer cells. Mann–Whitney U-test (B, D). Data summary represented by median ± interquartile range.

  5. Results in C and D were confirmed by independent co-staining of serial sections with αSMA (red) and FGFR1 (green).

  6. Significant correlation was found between the presence of FGF2 and FGFR1 in the nuclei of stromal fibroblasts, from the 36 patients in B and D who had been scored for both FGFR1 and FGF2.
Data information: Scale Bar: 20 μm, IgG 100 μm.
Figure 2
Figure 2
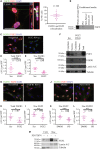
Pancreatic stellate cells show co-dependency of nuclear FGFR1 and FGF2 localisation. A Pancreatic stellate cells (PS1 cell line) showed punctate, nuclear speckles of FGFR1 staining (green) and diffuse nuclear FGF2 (red), with co-localisation (yellow, indicated by arrow head) confirmed by optical sectioning through the Z-axis (Z-stack) and pixel co-localisation techniques (50% of PS1 cells). Nuclear FGF2 was apparent only in those cells with nuclear FGFR1. B Serum-free conditioned media confirmed PS1, but not cancer cells, secrete high-and low-molecular weight (HMW 24 kDa and LMW 18 kDa, respectively) forms of FGF2. Whole cell lysate (untreated PS1 cells) and serum free medium were used as positive and negative controls respectively. C–E RNAi mediated knock-down of FGF2 (FGF2) resulted in a significant reduction in nuclear FGFR1 in PS1 cells in comparison to scrambled RNAi (Scr), as demonstrated by microscopic analysis. (D) ***P = 0.0009, (E) ***P = 0.0004. Student's t-test. Data summary represented by mean ± s.e.m. F Sub-cellular fractionation and subsequent immuno-blotting confirmed that FGFR1 expression was dependent upon FGF2. Total lysate was used as a positive control. Lamin A/C and tubulin were used as markers of fraction purity and loading control. G–I FGFR1 RNAi (FGFR) resulted in significant reduction in nuclear FGF2 compared to scrambled RNAi (Scr) treated PS1 cells. (H) *P = 0.0220. (I) **P = 0.0062. Student's t-test. Data summary represented by mean ± s.e.m. J–L FGFR inhibitor treatment (PD173074, 2 μM, 48 h) resulted in significant reduction in nuclear FGF2 and FGFR1 as compared to vehicle control (DMSO). (K) ***P = 0.0004, (L) **P = 0.0013. Student's t-test. Data summary represented by mean ± s.e.m. M Reduction in nuclear HMW and LMW isoforms of FGF2 upon FGFR inhibition (PD173074) was confirmed by sub-cellular fractionation. Data information: Scale Bar, 20 μm. For analysis of nuclear FGFR1 and FGF2, each data point shown represents an average of total or nuclear FGFR1 or FGF2 per field per experiment. Several fields were counted per experiment. The total number of PS1 cells analysed is recorded in the figure (n). For all data, images are representative of three independent experiments. Source data are available for this figure.
Figure 3
Figure 3
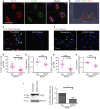
Stellate cell nuclear FGFR1 is associated with PSC proliferation. A FGFR1 (green) co-localised with splicing assembly factor, SC35 (red) at distinct nuclear speckles within the nuclei of stellate cells. B Pixel intensity analysis confirmed this co-localisation, with perfect overlap of red and green staining signals within the nucleus (blue). C–H RNAi-mediated knock-down of FGF2 (C, D) and FGFR1 (F, G) in stellate cells resulted in a significant reduction in proliferative index (% Ki67 positive cells, D, G; each data point represents percent of cells positive for Ki67 per field, multiple fields were taken per experiment. A total of 216 PS1 cells were analysed.) and, consequently, total cell count (E, H; each data point refers to one technical repeat. Three technical repeats were carried out per experiment, each experiment was carried out in triplicate.), relative to scrambled RNAi control (Scr). D, ***P = 0.0001. E, **P = 0.0081. G, ***P=<0.0001. H, ***P = <0.0001. Student's t-test. Data summary is represented by mean ± s.e.m. I RNAi-mediated knock-down of FGFR1 in stellate cells resulted in a significant reduction in FGF2 expression (HMW form). *P = 0.0423. Student's t-test. Data summary is represented by mean ± s.e.m. Data information: Scale Bar: 20 μm. For all data, images are representative of three independent experiments. Source data are available for this figure.
Figure 4
Figure 4
Blocking FGFR signalling results in a G1 block in PSCs. A–C Drug-mediated inhibition of FGFR (PD173074, 2 μM) resulted in a significant reduction in proliferative index (Ki67 positive cells, A, B; each data point represents percent of cells positive for Ki67 per field, multiple fields were taken per experiment. A total of 216 cells stellate cells were analysed.) and cell growth (C; each data point refers to one technical repeat. Three technical repeats were carried out per experiment.) after 5 days treatment compared to vehicle (DMSO) treated cells. B, ***P = <0.0001. C, ***P = <0.0001 (120 h). Student's t-test. Data summary is represented by mean ± s.e.m. D,E Cell cycle analysis after treatment with PD170374 (PD) for 48 h revealed a G1 cell cycle block in stellate cells compared to vehicle-treated (DMSO) cells. Representative cell cycle data after propidium iodide staining and analysis by FACS, are shown. F PD170374 treatment (PD) resulted in significant reduction in Cyclin D1 expression. HSC70 was used as a loading control. *P = 0.0414. Student's t-test. Data summary is represented by mean ± s.e.m. Data information: Scale Bar: 20 μm. For all data, images are representative of three independent experiments, except cell cycle data, which are representative of two independent experiments. Source data are available for this figure.
Figure 5
Figure 5
FGFR inhibition in stellate cells leads to reduced cancer cell invasion.
  1. Schematic model of raised air-liquid organotypic culture model as described in Methods.

  2. A 2 × 2 experimental design, with COLO-357 cells alone or PS1 and COLO-357 cells co-cultured in the presence or absence of PD173074 (2 μM) for 14 days, was used to detect consequences of inhibition of FGFR1 signalling. H&E images showed that COLO-357 cells alone formed a thin monolayer on top of the extra-cellular matrix (ECM), and were not affected by FGFR inhibition (PD173074). In the presence of stellate cells (PS1), there was a marked increase in cancer cell (COLO-357) number as well as invasion into the ECM (arrow head). This invasion was abrogated by FGFR inhibition (PD173074).

  3. Cytokeratin (green) and vimentin (red) staining, to delineate tumour and PS1 cells, respectively, confirmed a significant decrease in cancer cell invasion into the ECM upon FGFR inhibition (PD173074), compared to vehicle-treated (DMSO) cultures. Stellate cells appeared trapped within the overlying cell layer following PD173074 treatment and failed to migrate into the underlying ECM.

  4. Graph shows the reduction in cancer cell invasion into the ECM when cultures were treated with PD173074. Invading cohorts were analysed over twelve fields per organotypic gel. Each data point represents an average of invading cohorts across these twelve fields per gel. ***P = <0.0001. Student's t-test. Data summary represented by median ± interquartile range.

  5. There was no significant change in proliferative index (Ki67 staining) in organotypic cultures treated with PD173074 when PS1 and cancer cells were admixed, relative to when cancer cells were cultured alone. Student's t-test. Data summary represented by mean ± s.e.m.

Data information: Scale Bar: 100 μm. Images are representative of at least nine organotypic gels for each condition from three independent experiments.
Figure 6
Figure 6
Differential FGFR1 localisation in stellate cells upon FGFR inhibition in 3D cultures. A–C The percentage of stellate cells (identified by vimentin stain: red) demonstrating nuclear FGFR1 (green) was significantly less in the stellate cells that failed to invade into the extra-cellular matrix) as compared to those invading (arrow in A) in vehicle-treated organotypic cultures. Upon FGFR inhibition (PD173074), stellate cells failed to localise FGFR1 to the nucleus and did not invade into the matrix (arrow in B, quantified in C). A total of four fields were counted per organotypic gel. Each data point represents an average of the percentage of stellate cells with nuclear FGFR1 over these four fields (total of 540 cells counted). C, *P = 0.0366, **P = 0.0092. D, **P = 0.0017. Student's t-test. Data summary represented by mean ± s.e.m. D Nuclear FGFR was also analysed in vimentin positive invading and ‘trapped’ stellate cells following PD173074 treatment, using Image J digital quantification (see Methods). Those cells that were able to invade (vehicle treated) showed significantly more nuclear FGFR1 than those cells that remained trapped in the cell layer following PD173074 treatment. Each data point represents the average nuclear FGFR1 intensity per field. Several fields were counted from three separate gels (a total of 120 stellate cells per condition were analysed). E, F Stellate cells were treated with FGFR1 or scrambled RNAi for 24 h before harvesting and culture in a mini-organotypic model admixed with COLO-357 cells in a 2:1 ratio. Gels were cultured for 7 days. H&E images show a significant reduction in total cell invasion when PS1 cells were depleted for FGFR1 compared to scrambled treated PS1 cells. Number of invading cells is quantified in F. **P = 0.0031. Student's t-test. Data summary represented by median ± interquartile range. Data information: Scale Bar: 100 μm. Images are representative of at least nine organotypic gels for each condition.
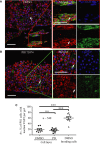
Figure 7
Figure 7
Differential FGF2 localisation in stellate cells upon FGFR inhibition in 3D cultures. In vehicle-treated organotypic cultures, FGF2 (red) was nuclear in a significant percentage of stellate cells (identified by αSMA stain: green, arrow in A, quantified in C) that invaded into the extra-cellular matrix, compared to those that remained within the admixed cell layer on top of the gel (arrow head in A). Upon FGFR inhibition (PD173074, 2 μM, 14 days), stellate cells failed to invade into the ECM. FGF2 was mainly cytoplasmic in these non-invading stellate cells (arrow in B). A total of four fields were counted per organotypic gel and each data point represents an average of percentage of stellate cells with nuclear FGF2 over these four fields (total of 540 cells counted). C, ***P < 0.0001. Student's t-test. Data summary represented by mean ± s.e.m. Data information: Scale Bar: 100 μm. Images are representative of at least nine organotypic gels for each condition.
Figure 8
Figure 8
Fibroblasts at the invasive front of human PDAC show significantly more nuclear FGF2 and FGFR1. A, B H&E stained sections adjacent to those used for FGFR1 and FGF2 staining show the tumour invading into adipose tissue (A) or the central section of the tumour (B). C–E Fibroblasts (vimentin positive, red) invading adipose tissue (invasive front demarcated, C) in PDAC sections showed increased nuclear FGFR1 (green) relative to those at the centre of the tumour (D) (magnification of boxed areas, which represent stromal fibroblasts, are shown in Ci, Cii, Di and Dii). Quantification (E) of PDAC patient sections showed that a significantly higher number of fibroblasts at the invasive edge of the tumour (invading adipose, normal tissue or duodenum) had nuclear FGFR1, compared to those fibroblasts close to the centre of the tumour. E. ***P = 0.0001. Mann–Whitney U-test. Data summary represented by median ± interquartile range. F–H Staining of serial sections of the same tumour as in C, revealed that a significantly higher number of myo-fibroblasts (αSMA positive, green) invading adipose tissue in PDAC sections (F) showed nuclear FGF2 (red), compared to those at the centre of the tumour (G) (magnification of boxed areas, which represent stromal fibroblasts, are shown in Fi, Fii, Gi and Gii). Quantification is shown in (H). Each data point represents the percentage of fibroblasts (vimentin or αSMA positive) with nuclear FGFR1 or FGF2 per field. Several fields at the invasive front or centre of the tumour were quantified per patient. Stromal fibroblasts were analysed in four patients (n = 4640 fibroblasts at the invasive front and central tumour were counted in total).H. ***P < 0.0001. Mann–Whitney U-test. Data summary represented by median ± interquartile range. Data information: Scale Bar: 20 μm.

Similar articles

Cited by

References

    1. Apte MV, Haber PS, Applegate TL, Norton ID, McCaughan GW, Korsten MA, Pirola RC, Wilson JS. Periacinar stellate shaped cells in rat pancreas: identification, isolation, and culture. Gut. 1998;43:128–133. - PMC - PubMed
    1. Apte MV, Haber PS, Darby SJ, Rodgers SC, McCaughan GW, Korsten MA, Pirola RC, Wilson JS. Pancreatic stellate cells are activated by proinflammatory cytokines: implications for pancreatic fibrogenesis. Gut. 1999;44:534–541. - PMC - PubMed
    1. Apte MV, Park S, Phillips PA, Santucci N, Goldstein D, Kumar RK, Ramm GA, Buchler M, Friess H, McCarroll JA, et al. Desmoplastic reaction in pancreatic cancer: role of pancreatic stellate cells. Pancreas. 2004;29:179–187. - PubMed
    1. Bachem MG, Schunemann M, Ramadani M, Siech M, Beger H, Buck A, Zhou S, Schmid-Kotsas A, Adler G. Pancreatic carcinoma cells induce fibrosis by stimulating proliferation and matrix synthesis of stellate cells. Gastroenterology. 2005;128:907–921. - PubMed
    1. Bouche G, Gas N, Prats H, Baldin V, Tauber JP, Teissie J, Amalric F. Basic fibroblast growth factor enters the nucleolus and stimulates the transcription of ribosomal genes in ABAE cells undergoing G0—G1 transition. Proc Natl Acad Sci USA. 1987;84:6770–6774. - PMC - PubMed

Publication types

MeSH terms

Substances