. 2014 May 15;92(100):27-35.
doi: 10.1016/j.neuroimage.2014.01.031. Epub 2014 Feb 3.

CSF contamination contributes to apparent microstructural alterations in mild cognitive impairment

Affiliations

CSF contamination contributes to apparent microstructural alterations in mild cognitive impairment

Rok Berlot et al. Neuroimage. .

Abstract

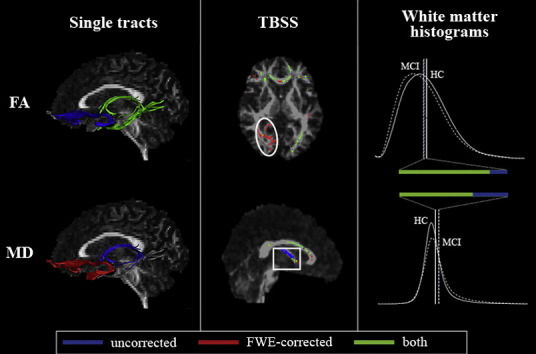
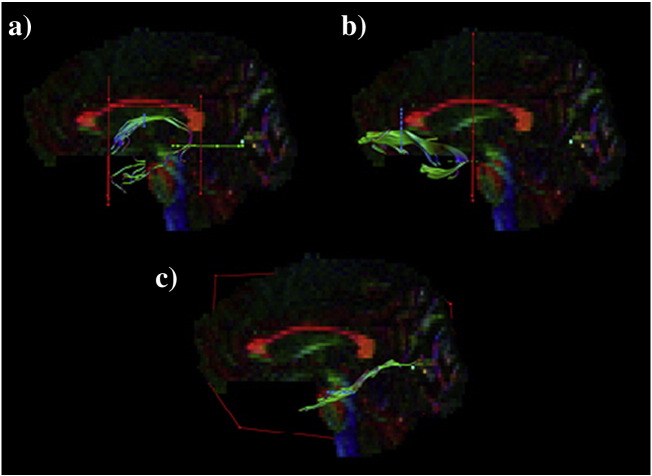
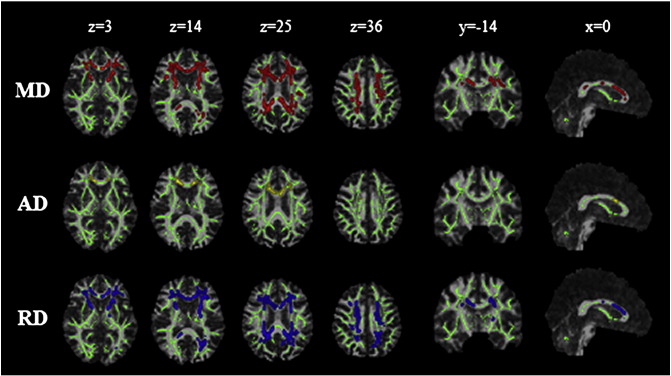
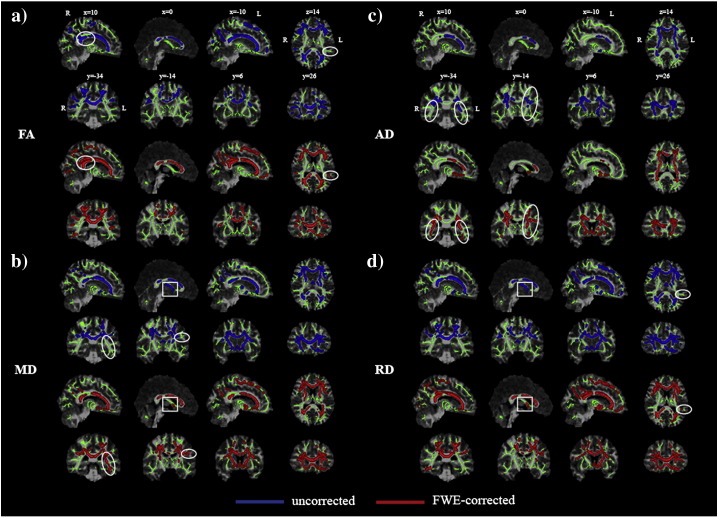
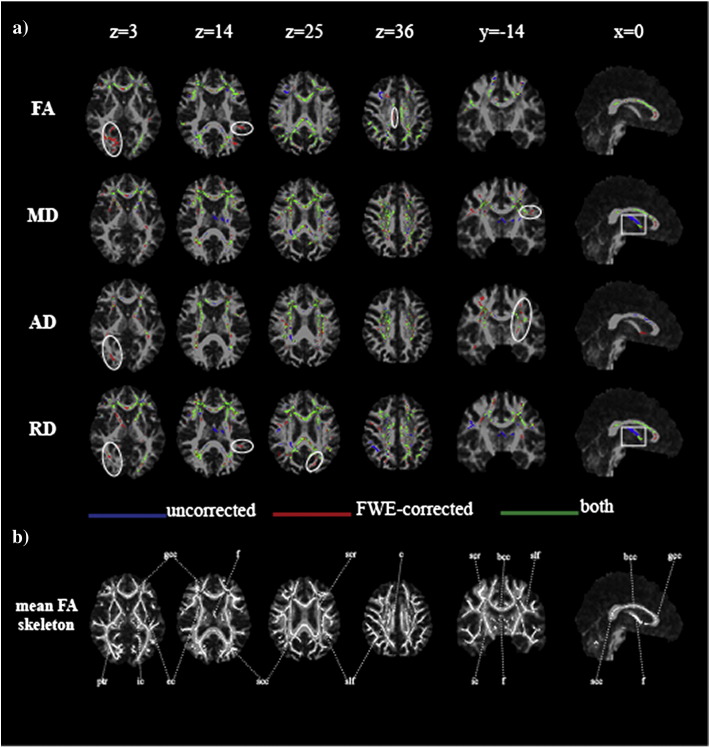
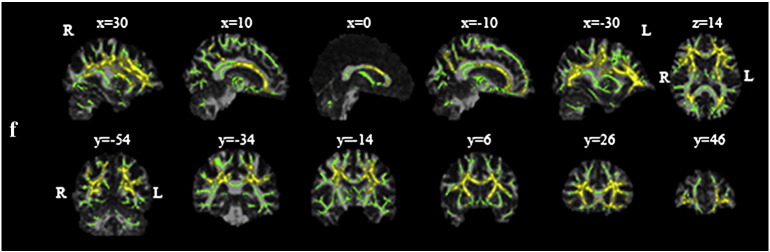
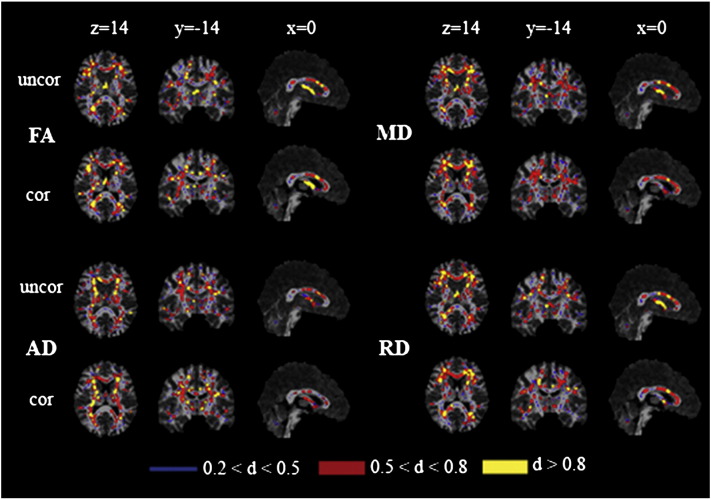
Diffusion MRI is used widely to probe microstructural alterations in neurological and psychiatric disease. However, ageing and neurodegeneration are also associated with atrophy, which leads to artefacts through partial volume effects due to cerebrospinal-fluid contamination (CSFC). The aim of this study was to explore the influence of CSFC on apparent microstructural changes in mild cognitive impairment (MCI) at several spatial levels: individually reconstructed tracts; at the level of a whole white matter skeleton (tract-based spatial statistics); and histograms derived from all white matter. 25 individuals with MCI and 20 matched controls underwent diffusion MRI. We corrected for CSFC using a post-acquisition voxel-by-voxel approach of free-water elimination. Tracts varied in their susceptibility to CSFC. The apparent pattern of tract involvement in disease shifted when correction was applied. Both spurious group differences, driven by CSFC, and masking of true differences were observed. Tract-based spatial statistics were found to be robust across much of the skeleton but with some localised CSFC effects. Diffusivity measures were affected disproportionately in MCI, and group differences in fornix microstructure were exaggerated. Group differences in white matter histogram measures were also partly driven by CSFC. For diffusivity measures, up to two thirds of observed group differences were due to CSFC. Our results demonstrate that CSFC has an impact on quantitative differences between MCI and controls. Furthermore, it affects the apparent spatial pattern of white matter involvement. Free-water elimination provides a step towards disentangling intrinsic and volumetric alterations in individuals prone to atrophy.

Keywords: Atrophy; Diffusion MRI; Mild cognitive impairment; Partial volume effects; Tract-based spatial statistics; Tractography.


Figures

None
Graphical abstract
Suppl. Fig. 1
Suppl. Fig. 1
Reconstructions of temporal association tracts. Tractography using region of interest (ROI) waypoints (seedpoint ROIs depicted in blue, AND ROIs in green, NOT ROIs in red) in the native space of one participant for: a) fornix; b) uncinate fasciculus; c) parahippocampal cingulum.
Suppl. Fig. 2
Suppl. Fig. 2
Group differences in the spatial pattern of CSF contamination. A group comparison of difference images was performed: areas showing significantly higher influence of CSF partial volume effect on diffusivity parameter values in MCI are highlighted in colour (corrected for family-wise error and thresholded for p < .05). Statistical maps are overlaid on the registration target brain transformed into MNI152 space.
Fig. 1
Fig. 1
Group differences based on tract-based spatial statistics, before (dark grey; blue in online version) and after (white; red in online version) correction of images by Free Water Elimination. a) Results for reduced fractional anisotropy (FA); b) increased mean diffusivity (MD); c) increased axial diffusivity (AD); d) increased radial diffusivity (RD). Statistical maps are corrected for family-wise error and thresholded for p < .05. They are overlaid on the registration target brain, transformed into MNI152 space. Box: fornix microstructural differences due to partial volume effect. Circle: group differences observed only in the corrected analysis.
Fig. 2
Fig. 2
Group differences before and after Free Water Elimination superimposed on a common target image. a) Mean FA skeleton voxels showing significantly lower value of fractional anisotropy (FA) and higher values of mean (MD), axial (AD) and radial diffusivity (RD) in patients with mild cognitive impairment only in uncorrected dataset (dark grey; blue in online version), only after applying the free-water elimination (FWE) correction for CSF contamination (white; red in online version) or in both datasets (light grey; green in online version). Displayed results are corrected for family-wise error and thresholded for p < .05. Box: fornix microstructural differences due to partial volume effect. Circle: group differences observed only in the corrected analysis. b) Mean FA skeleton with labels according to JHU ICBM-DTI-81 White-Matter Labels atlas (bcc—body of corpus callosum, c—cingulum, ec—external capsule, f—fornix, gcc—genu of corpus callosum, ic—internal capsule, ptr—posterior thalamic radiation, scc—splenium of corpus callosum, scr—superior corona radiata, slf—superior longitudinal fasciculus). Statistical maps are overlaid on the registration target brain transformed into MNI152 space. Images are displayed in radiological view.
Fig. 3
Fig. 3
Group differences in tissue volume fraction (f). Regions of significant reduction of f in MCI are shown in white (yellow in online version). The background skeleton is shown in dark grey (green in online version). Displayed results are corrected for family-wise error and thresholded for p < .05. Statistical maps are overlaid on the registration target brain transformed into MNI152 space.
Fig. 4
Fig. 4
Effect sizes before and after Free Water Elimination. Maps of Cohen's d for differences in the values of fractional anisotropy (FA), mean (MD), axial (AD) and radial diffusivity (RD) in patients with mild cognitive impairment compared to controls throughout the mean FA skeleton for the uncorrected dataset (uncor) and after correcting for partial volume effect (cor). Effect sizes are displayed according to their values—small (thin white line, blue in online version), medium (thick white line, red in online version) and large (thick dark grey line, yellow in online version). Statistical maps are overlaid on the registration target brain transformed into MNI152 space. Images are displayed in radiological view.

References

    1. Albert M.S., DeKosky S.T., Dickson D., Dubois B., Feldman H.H., Fox N.C. The diagnosis of mild cognitive impairment due to Alzheimer's disease: recommendations from the National Institute on Aging-Alzheimer's Association workgroups on diagnostic guidelines fo Alzheimer's disease. Alzheimers Dement. 2011;7(3):270–279. (May) - PMC - PubMed
    1. Assaf Y., Alexander D.C., Jones D.K., Bizzi A., Behrens T.E., Clark C.A. The CONNECT project: combining macro- and micro-structure. Neuroimage. 2013;80:273–282. (Oct 15) - PubMed
    1. Basser P.J., Mattiello J., LeBihan D. Estimation of the effective self-diffusion tensor from the NMR spin echo. J. Magn. Reson. B. 1994;103(3):247–254. (Mar) - PubMed
    1. Canu E., McLaren D.G., Fitzgerald M.E., Bendlin B.B., Zoccatelli G., Alessandrini F. Microstructural diffusion changes are independent of macrostructural volume loss in moderate to severe Alzheimer's disease. J. Alzheimers Dis. 2010;19(3):963–976. - PMC - PubMed
    1. Chabriat H. Diffusion histograms in CADASIL. Stroke. 2005;36(12):2526. (Dec) - PubMed

Publication types