

Adipogenic effects of a combination of the endocrine-disrupting compounds bisphenol A, diethylhexylphthalate, and tributyltin
- PMID: 24503497
- PMCID: PMC5644809
- DOI: 10.1159/000358913
Adipogenic effects of a combination of the endocrine-disrupting compounds bisphenol A, diethylhexylphthalate, and tributyltin
Abstract
Objective: The food contaminants bisphenol A (BPA), diethylhexylphthalate (DEHP), and tributyltin (TBT) are potent endocrine-disrupting compounds (EDC) known to interfere with adipogenesis. EDC usually act in mixtures and not as single compounds. The aim of this study was to investigate the effects of a simultaneous exposure of BPA, DEHP, and TBT on mesenchymal stem cell differentiation into adipocytes.
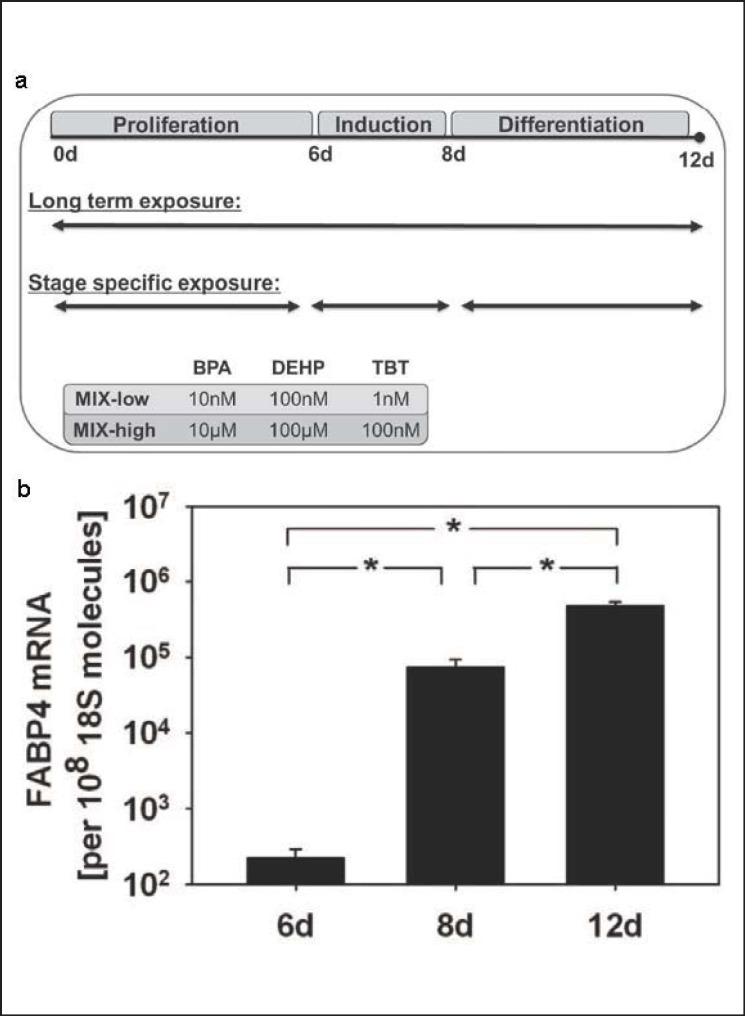
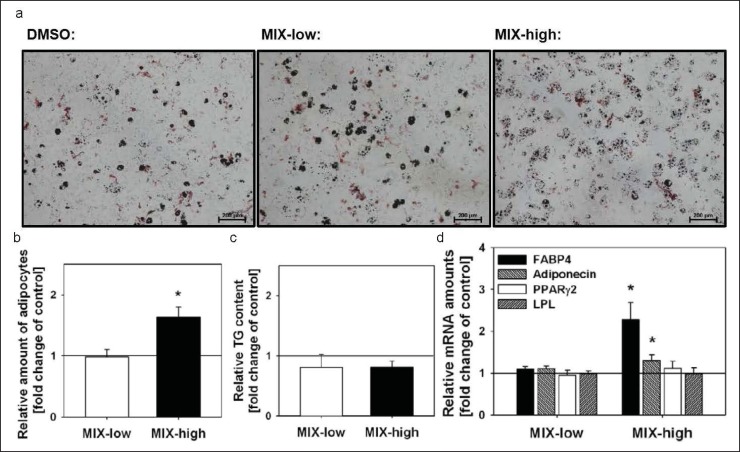
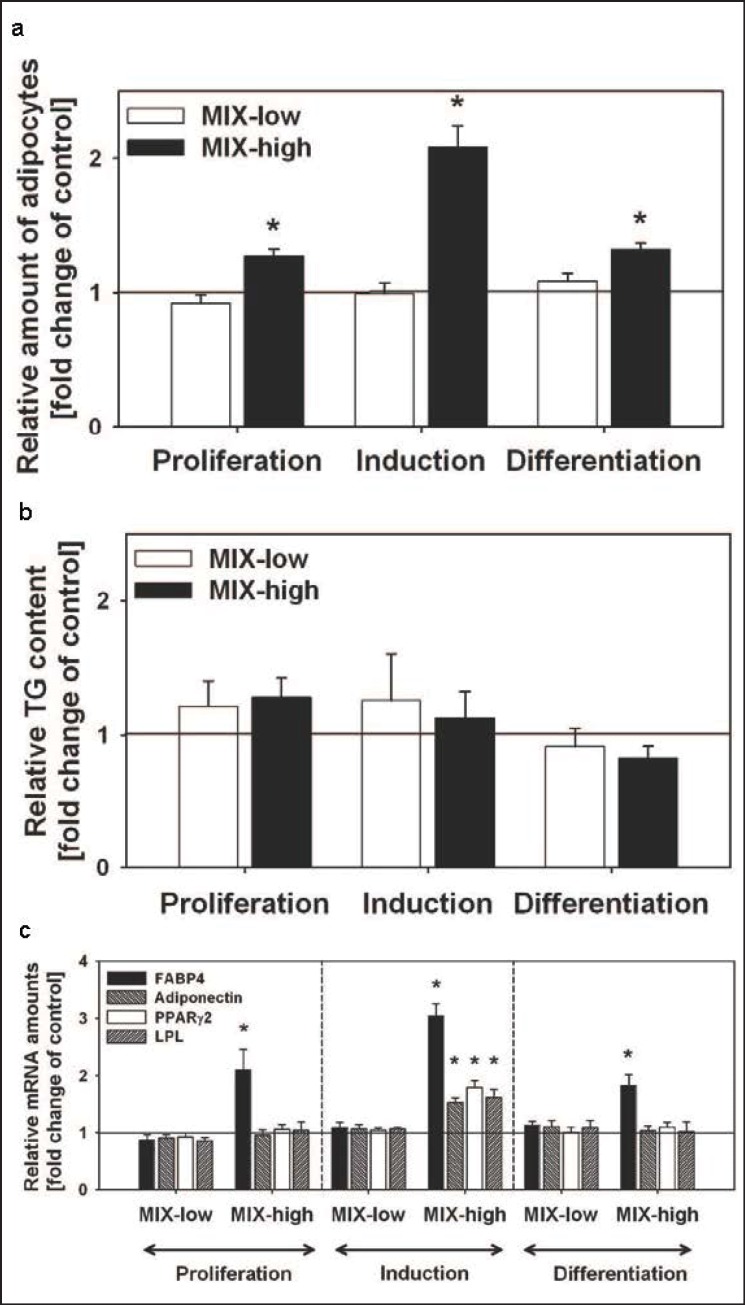
Methods: Multipotent murine mesenchymal stem cells (C3H10T1/2) were exposed to EDC mixtures in high concentrations, i.e. MIX-high (10 µmol/l BPA, 100 µmol/l DEHP, 100 nmol/l TBT), and in environmentally relevant concentrations, i.e. MIX-low (10 nmol/l BPA, 100 nmol/l DEHP, 1 nmol/l TBT). The exposure was performed either for the entire culture time (0-12 days) or at distinct stages of adipogenic differentiation. At day 12 of cell culture, the amount of adipocytes, triglyceride content (TG), and adipogenic marker gene expression were analyzed.
Results: MIX-high increased the development of adipocytes and the expression of adipogenic marker genes independently of the exposure window. The total TG amount was not increased. The low-concentrated EDC mixture had no obvious impact on adipogenesis.
Conclusion: In EDC mixtures, the adipogenic effect of TBT and DEHP predominates single effects of BPA. Mixture effects of EDC are not deducible from single compound experiments.
© 2014 S. Karger GmbH, Freiburg.
Figures
References
-
- Ogden CL, Yanovski SZ, Carroll MD, Flegal KM. The epidemiology of obesity. Gastroenterology. 2007;132:2087–2102. - PubMed
-
- Finucane MM, Stevens GA, Cowan MJ, Danaei G, Lin JK, Paciorek CJ, Singh GM, Gutierrez HR, Lu Y, Bahalim AN, Farzadfar F, Riley LM, Ezzati M. National, regional, and global trends in body-mass index since 1980: systematic analysis of health examination surveys and epidemiological studies with 960 country-years and 9.1 million participants. Lancet. 2011;377:557–567. - PMC - PubMed
-
- Wang Y, Lobstein T. Worldwide trends in childhood overweight and obesity. Int J Pediatr Obes. 2006;1:11–25. - PubMed
-
- de Onis M, Blossner M, Borghi E. Global prevalence and trends of overweight and obesity among preschool children. Am J Clin Nutr. 2010;92:1257–1264. - PubMed
-
- Casals-Casas C, Desvergne B. Endocrine disruptors: from endocrine to metabolic disruption. Annu Rev Physiol. 2011;73:135–162. - PubMed
Publication types
MeSH terms
Substances
LinkOut - more resources
Full Text Sources
Other Literature Sources
Medical
Miscellaneous
