. 2014 Apr;11(2):026001.
doi: 10.1088/1741-2560/11/2/026001. Epub 2014 Feb 6.

Self-recalibrating classifiers for intracortical brain-computer interfaces

Affiliations

Self-recalibrating classifiers for intracortical brain-computer interfaces

William Bishop et al. J Neural Eng. 2014 Apr.

Abstract

Objective: Intracortical brain-computer interface (BCI) decoders are typically retrained daily to maintain stable performance. Self-recalibrating decoders aim to remove the burden this may present in the clinic by training themselves autonomously during normal use but have only been developed for continuous control. Here we address the problem for discrete decoding (classifiers).

Approach: We recorded threshold crossings from 96-electrode arrays implanted in the motor cortex of two rhesus macaques performing center-out reaches in 7 directions over 41 and 36 separate days spanning 48 and 58 days in total for offline analysis.

Main results: We show that for the purposes of developing a self-recalibrating classifier, tuning parameters can be considered as fixed within days and that parameters on the same electrode move up and down together between days. Further, drift is constrained across time, which is reflected in the performance of a standard classifier which does not progressively worsen if it is not retrained daily, though overall performance is reduced by more than 10% compared to a daily retrained classifier. Two novel self-recalibrating classifiers produce a ~15% increase in classification accuracy over that achieved by the non-retrained classifier to nearly recover the performance of the daily retrained classifier.

Significance: We believe that the development of classifiers that require no daily retraining will accelerate the clinical translation of BCI systems. Future work should test these results in a closed-loop setting.


Figures

Figure 1
Figure 1
A representative trial of the center out reaching task (Monkey L, trial ID: R,2008-12-26,mm, 109). The top row is the behavioral task. The middle row contains spike rasters across 96 electrodes and the bottom row presents the timecourse of the hand position. Full range of scale for the hand position is 15 cm.
Figure 2
Figure 2
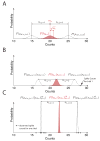
An illustration of the probabilistic distribution over tuning parameters for the self-recalibrating classifier at three different points in time during a decoding session on day d for an example where spike counts recorded on one electrode are used to predict reaches in one of two directions. Panel A shows the distribution over the base value for the day, bd,e, for the electrode at the start of the decoding day before any neural activity is available. This distribution is a Gaussian distribution with mean me and variance se. In all panels, distributions over bd,e are shown in red to indicate that this is the distribution the self-recalibrating classifier explicitly represents. Panel A also shows the distributions over μd,e,j=1 and μd,e,j=2, which are the mean number of spike counts conditioned on reaching in directions 1 and 2. The classifier does not explicitly represent these distributions, but they can be recovered from the distribution over bd,e with the formula μd,e,j = bd,e + oe,j . Panel B shows the distributions over bd,e, μd,e,j=1 and μd,e,j=2 after spike counts for one trial have been observed. Importantly, note that the true reach direction associated with this spike count is not made available to the classifier. Panel C shows distributions over the same quantities after 10 trials have been observed. The solid dots in panels B and C represent spike counts observed on individual trials.
Figure 3
Figure 3
Graphical models for the generation of a single spike count on electrode e for trial t on day d for the standard (A) and self-recalibrating (B) classifiers. Circles denote random variables and dots indicate model parameters. In the standard classifier, the electrode-class means, μe,j, and variances, ve,j, for all reach directions directly characterize the distribution over observed spike counts, xd,e,t. For the self-recalibrating classifier, the base value for electrode e, bd,e, is randomly generated each day from a Gaussian distribution with mean me and variance se. For a given base value, spike counts are produced according to a distribution with electrode-class means μe,j = bd,e + oe,j and variances ve,j . In this figure, the notation {ve,j}j=1J and {μe,j}j=1J indicates the set of variances and means, respectively, for all reach directions for electrode e.
Figure 4
Figure 4
An illustration of how the SRS classifier predicts reach direction for a single trial. Starting from the top, spike counts, xd,t, for trial t are recorded and the SRS decoder updates its estimate for the day’s base values, d,e,t, using a simple accumulated average. Updated estimates for tuning parameters, μ̂d,e,j, are then calculated from the updated estimates of the base values. Finally, the standard classifier is used with the updated tuning parameters to predict reach direction.
Figure 5
Figure 5
Statistical structure of changes in tuning parameters across days for monkey L. Panel A: Example traces of μ̂d,e,j,t for two representative tuning parameters on the same electrode across the first 25 days of data. Background shading represents day boundaries. Panel B: Distribution of the between (se,j for all e and j) and within-day (sd,e,j for all d, e, and j) standard deviations of tuning parameters. A small number (.08%) of within-day standard deviations are outside the range of this plot. Panel C: Daily means (black dots) and associated ellipses which indicate regions in which tuning parameters for each day fall with approximately 95% probability for the same μ̂d,e,j,t parameters shown in panel A on each of the 41 days of recorded data. Panel D: Distribution of correlation coefficients computed across and within electrode pairs. To relate panel C to D, the correlation of the cloud of 41 black points in (C) is one of the 96×(72) pairs of correlations that was used to construct the “same electrode” distribution in panel D. Panel E: Average values with 95% confidence intervals of unsigned percent change of mean tuning parameter values on days 2–41 from their corresponding value on day 1. Three electrodes were withheld form this analysis due to the small value of the tuning parameter for one or more reach directions on day 1. See text for details.
Figure 6
Figure 6
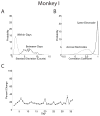
Summary of the statistical structure of changes in tuning parameters across days for monkey I. Panels A, B and C correspond to panels B, D and E in Fig. 5. No electrodes were withheld when calculating the average shown in panel C. For space reasons, panels showing representative parameters traces and the spread of values for a pair of tuning parameters are not shown for monkey I.
Figure 7
Figure 7
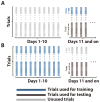
Partitioning of data when testing classifiers with (A) and without (B) daily retraining as described in Methods. Each column of rectangles represents an experimental day of collected data, and each rectangle represents a trial.
Figure 8
Figure 8
Daily accuracy values for the standard non-retrained and retrained classifiers for both subjects with 95% confidence intervals. The retrained classifier was retrained each day while the non-retrained classifier was trained on days preceding those decoded here and then held fixed. See Fig. 7 for a depiction of the partitioning of data when training and testing each classifier. The dashed line in each panel shows a linear fit of daily accuracy of the non-retrained classifier with test day. The slope of this fit is not significantly different from zero for either subject. Arrows on the right show overall accuracies of each classifier.
Figure 9
Figure 9
Daily performance of the self-recalibrating (top panel) and simplified self-recalibrating (bottom panel) classifiers with 95% confidence intervals for data from monkey L. Arrows on the right show overall accuracies of each classifier. Results for the standard classifier with and without daily retraining are reproduced from Fig. 8 for reference.
Figure 10
Figure 10
Daily performance of the self-recalibrating (top panel) and simplified self-recalibrating (bottom panel) classifiers with 95% confidence intervals for data from monkey I. Arrows on the right show overall accuracies of each classifier. Results for the standard classifier with and without daily retraining are reproduced from Fig. 8 for reference.
Figure 11
Figure 11
Average accuracy throughout a decoding session for the SR and SRS classifiers for both subjects with 95% confidence intervals. Accuracy values are calculated as the average classification accuracy in sequential bins of 20 trials over all test days for a subject. There were 386 or more trials for classification on each test day for monkey L and 752 or more on each test day for monkey I. Panels A and C show results for monkey L, while panels B and D show results for monkey I.
Figure 12
Figure 12
Estimates of tuning parameters on two representative electrodes (left and right columns) produced by the SR (top) and SRS (bottom) classifiers on the first five days of test data for monkey L compared to smoothed estimates obtained by convolving spikes with a Gaussian kernel. The “spikes” in the tuning parameter estimate of the SR classifier occur when the mechanism for detecting anomalous spike counts is triggered and the uncertainty around the parameter estimates for an electrode is reset. The false positive rate for detecting anomalous spikes was set to approximately 1%, and the rate of spikes seen in this plot should not be understood as the true rate of anomalous events.

References

    1. Achtman N, Afshar A, Santhanam G, Byron MY, Ryu SI, Shenoy KV. Free-paced high-performance brain–computer interfaces. Journal of Neural Engineering. 2007;4:336–347. - PubMed
    1. Aggarwal V, Acharya S, Tenore F, Shin HC, Etienne-Cummings R, Schieber MH, Thakor NV. Asynchronous decoding of dexterous finger movements using m1 neurons. IEEE Transactions on Neural Systems and Rehabilitation Engineering. 2008;16(1):3–14. - PMC - PubMed
    1. Blom H, Bar-Shalom Y. The interacting multiple model algorithm for systems with markovian switching coefficients. Automatic Control, IEEE Transactions on. 1988;33(8):780–783.
    1. Blumberg J, Rickert J, Waldert S, Schulze-Bonhage A, Aertsen A, Mehring C. Adaptive classification for brain computer interfaces. Proc. of the 29th Annual International Conf. of the IEEE EMBS; Lyon, France. 2007. pp. 2536–2539. - PubMed
    1. Brunner P, Ritaccio A, Emrich J, Bischof H, Schalk G. Rapid communication with a “p300” matrix speller using electrocorticographic signals (ecog) Frontiers in Neuroscience. 2011;5:1–9. - PMC - PubMed

Publication types

LinkOut - more resources