. 2014 Feb 4;9(2):e87649.
doi: 10.1371/journal.pone.0087649. eCollection 2014.

Choose your label wisely: water-soluble fluorophores often interact with lipid bilayers

Affiliations

Choose your label wisely: water-soluble fluorophores often interact with lipid bilayers

Laura D Hughes et al. PLoS One. .

Abstract

Water-soluble organic fluorophores are widely used as labels in biological systems. However, in many cases these fluorophores can interact strongly with lipid bilayers, influencing the interaction of the target with the bilayer and/or leading to misleading fluorescent signals. Here, we quantify the interaction of 32 common water-soluble dyes with model lipid bilayers to serve as an additional criterion when selecting a dye label.


Conflict of interest statement

Competing Interests: The authors have declared that no competing interests exist.

Figures

Figure 1
Figure 1. Example raw fluorescence spectra of three dyes.
The dyes are representative of low (Alexa 647-SE), moderate (Alexa 594-M), and high (Atto 647N-M) MIF values. Flin_raw is the raw fluorescence spectrum of the vesicle solution inside the dialysis cassette, collected and prepared as described above. Flout_raw is the raw fluorescence spectrum of the solution outside the dialysis cassette. MIF values are the corrected MIF values averaged across three separate measurements, as reported in Table 1. Emission fluorescence is in arbitrary units.
Figure 2
Figure 2. Bar graph of membrane interaction factors (MIF, Table 1 ), sorted by excitation maximum.
Dyes below the bottom dashed line (MIF<0.1) exhibit little to no association with Egg PC lipid bilayers, while dyes above the second dashed line (MIF>1) strongly associate with membranes. Note that the y-axis changes substantially at MIF>1.1. Each data point represents the average of three independent measurements, ± propagated error of the standard deviation.
Figure 3
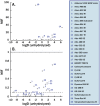
Figure 3. Correlation of MIF values with calculated log D.
Calculated log D values are given in Table 1. (A) The MIF value shows moderate correlation with calculated log D values, based on the unhydrolyzed dye structures. (B) Zoom-in on dyes with MIF values below 1. Dyes with a MIF below the bottom dashed line (MIF<0.1) show little association with membranes, and dyes above the top dashed line (MIF>1) show appreciable interaction with lipid bilayers. MIF values shown here are the MIFcorr values given in Table 1.
Figure 4
Figure 4. MIFcorr_neg values for a subset of dyes interacting with negatively charged 9∶1 Egg PC:DOPS vesicles.
For comparison, the corrected MIF values of the dyes with pure Egg PC (MIFcorr, solid bars) are shown to the left of the MIF values with DOPS (MIFcorr_neg, hashed bars). The MIF values in both lipid compositions, calculated as described in Equation 3, are displayed above each bar, and are given in Table 2. Dyes below the bottom dashed line (MIF<0.1) exhibit little to no association with Egg PC lipid bilayers, while dyes above the second dashed line (MIF>1) strongly associate with membranes. Note that the y-axis changes substantially at MIF>1.1. Each data point represents the average of three independent measurements, ± propagated error of the standard deviation. The difference between MIFcorr_neg and MIFcorr for all dyes shown is statistically significant at the p<0.05 level, as determined by a two-sample Kolmogrov-Smirnov test.
Figure 5
Figure 5. Observation of fluorophores interacting with lipid bilayers by fluorescence microscopy.
After incubating a dye solution with a supported lipid bilayer and rinsing, any remaining fluorescence was imaged. The Alexa 647-M and Abberior STAR 635P azide images are set to the same contrast, while the Alexa 633-M sample was appreciably brighter.

References

    1. Zanetti-Domingues LC, Martin-Fernandez ML, Needham SR, Rolfe DJ, Clarke DT (2012) A Systematic Investigation of Differential Effects of Cell Culture Substrates on the Extent of Artifacts in Single-Molecule Tracking. PLOS ONE 7: e45655. - PMC - PubMed
    1. Zanetti-Domingues LC, Tynan CJ, Rolfe DJ, Clarke DT, Martin-Fernandez M (2013) Hydrophobic Fluorescent Probes Introduce Artifacts into Single Molecule Tracking Experiments Due to Non-Specific Binding. PLOS ONE 8: e74200. - PMC - PubMed
    1. Loidl-Stahlhofen A, Eckert A, Hartmann T, Schöttner MJ (2001) Solid-supported lipid membranes as a tool for determination of membrane affinity: High-throughput screening of a physicochemical parameter. Pharm. Sci. 90: 599–606. - PubMed
    1. Pauletti GM, Wunderli-Allenspach H (1994) Partition coefficients in vitro: artificial membranes as a standardized distribution model. Eur. J. Pharm. Sci. 1: 273–282.
    1. White SH, Wimley WC, Ladokhin AS, Hristova K (1998) [4] Protein folding in membranes: Determining energetics of peptide-bilayer interactions. Methods Enzymol. 295: 62–87. - PubMed

Publication types