. 2014;6(4):435-55.
doi: 10.1159/000356963. Epub 2014 Feb 1.

Induction of phagocytosis and intracellular signaling by an inhibitory channel catfish leukocyte immune-type receptor: evidence for immunoregulatory receptor functional plasticity in teleosts

Affiliations

Induction of phagocytosis and intracellular signaling by an inhibitory channel catfish leukocyte immune-type receptor: evidence for immunoregulatory receptor functional plasticity in teleosts

Herman D Cortes et al. J Innate Immun. 2014.

Abstract

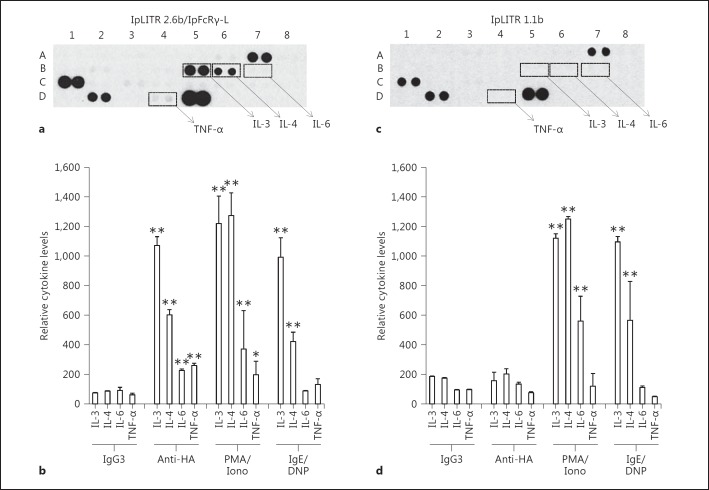
Immunoregulatory receptors are categorized as stimulatory or inhibitory based on their engagement of unique intracellular signaling networks. These proteins also display functional plasticity, which adds versatility to the control of innate immunity. Here we demonstrate that an inhibitory catfish leukocyte immune-type receptor (IpLITR) also displays stimulatory capabilities in a representative myeloid cell model. Previously, the receptor IpLITR 1.1b was shown to inhibit natural killer cell-mediated cytotoxicity. Here we expressed IpLITR 1.1b in rat basophilic leukemia-2H3 cells and monitored intracellular signaling and functional responses. Although IpLITR 1.1b did not stimulate cytokine secretion, activation of this receptor unexpectedly induced phagocytosis as well as extracellular signal-related kinase 1/2- and protein kinase B (Akt)-dependent signal transduction. This novel IpLITR 1.1b-mediated response was independent of an association with the FcRγ chain and was likely due to phosphotyrosine-dependent adaptors associating with prototypical signaling motifs within the distal region of its cytoplasmic tail. Furthermore, compared to a stimulatory IpLITR, IpLITR 1.1b displayed temporal differences in the induction of intracellular signaling, and IpLITR 1.1b-mediated phagocytosis had reduced sensitivity to EDTA and cytochalasin D. Overall, this is the first demonstration of functional plasticity for teleost LITRs, a process likely important for the fine-tuning of conserved innate defenses.


Figures

Fig. 1
Fig. 1
Cell surface expression of IpLITR types stably expressed in RBL-2H3 cells (b-e). Detection of the cell surface expression of IpLITR 2.6b/IpFcRγ-L, IpLITR 1.1b, IpLITR 1.2a, and IpLITR 1.1b ΔCYT in transfected, selected, and sorted RBL-2H3 cells. Stable expressing cells were stained by incubation with an anti-HA mAb (20 μg/ml) or IgG3 (isotype control) followed by staining with 0.5 μg goat anti-mouse IgG pAb coupled to PE. Surface expression was then detected as an increase in fluorescence intensity (i.e. HA staining, FL-2; grey line) in comparison with IgG3-stained cells (black line). Shown are representative stains for each receptor construct, which demonstrated consistent surface staining throughout this study. For comparison, parental (i.e. untransfected) RBL-2H3 cells are also shown (a).
Fig. 2
Fig. 2
Parallel examination of the relative cytokine levels produced by IpLITR-activated RBL-2H3 cells. RBL-2H3 cells (2.5 × 10⁶) expressing the N-terminal HA epitope-tagged IpLITR 2.6b/IpFcRγ-L (a, b) or IpLITR 1.1b (c, d) were cross-linked by treatment with 0.625 µg/ml mouse IgG3 (isotype control) or 0.625 µg/ml anti-HA mAb followed by 1.25 µg/ml anti-mouse IgG3 pAb (H+L) for 24 h at 37°C. Cell supernatants were then examined for the presence of various cytokines using the antibody capture chemiluminescent-based Rat Cytokine Array Panel Array Kit (R&D Systems). Transfected cells were also stimulated for 24 h at 37°C with 50 ng/ml PMA/0.5 µM Ca2+ ionophore A23187 (i.e. PMA/Iono) or after triggering them via their endogenous FcεRI with 200 ng/ml anti-DNP-IgE and 0.1 ng/ml DNP-HSA (i.e. IgE/DNP). Representative proteome profiler array results for anti-HA-activated IpLITR 2.6b/IpFcRγ-L and IpLITR 1.1b are shown (a, c); the calculated densitometry results of the relative cytokine levels are also displayed (b, d). The duplicate spots used for calculating the relative cytokine levels are indicated by the boxes, and these values were normalized for cross-array comparisons using the manufacturer's negative and positive controls standards. Densitometry of spot intensity was performed using ImageJ v1.44 software. The complete cytokine profiler array coordinates, representative array blots for IgG3-, PMA/Iono-, and IgE/DNP-treated cells, and the calculated densitometry results for cytokine levels following all experimental treatments are provided in the online supplementary material. Each bar represents the mean relative cytokine level ± SEM of 3 independent cytokine arrays. * p ≤ 0.01 and ** p ≤ 0.001 when comparing the relative cytokine levels for each experimental treatment to the cytokine levels of IgG3-treated cells.
Fig. 3
Fig. 3
Parallel examination of the relative amounts of MAPK and other serine/threonine kinase phosphorylation levels induced by IpLITR-activated RBL-2H3 cells. RBL-2H3 cells (2.5 × 10⁶) expressing the N-terminal HA epitope-tagged IpLITR 2.6b/IpFcRγ-L (a) or IpLITR 1.1b (b) were cross-linked by treatment with 0.625 µg/ml mouse IgG3 (isotype control) or 0.625 µg/ml anti-HA mAb followed by 1.25 µg/ml anti-mouse IgG3 pAb (H+L) for 10 min at 37°C. Cell lysates were then examined for the presence of phosphorylated proteins using the antibody capture chemiluminescent-based Human Phospho-MAPK Array Kit (R&D Systems). Representative proteome profiler array results for IgG3 isotype and anti-HA-activated IpLITR 2.6b/IpFcRγ-L (a, b) and IpLITR 1.1b (d, e); the calculated densitometry results of relative phospho-MAPK levels are also displayed (c, f). The duplicate spots used for calculating the relative levels of protein phosphorylation are indicated by the boxes, and these values were normalized for cross-array comparisons using the manufacturer's negative and positive control standards. Densitometry of spot intensity was performed using ImageJ v1.44 software. Each bar represents the mean spot intensity of the 2 indicated spots, and the data is representative of 2 independent experiments which gave similar profiler results. The complete phospho-MAPK array coordinates and the calculated densitometry results are provided in the online supplementary material.
Fig. 4
Fig. 4
Examination of ERK1/2 and Akt activation in IpLITR-activated RBL-2H3 cells. RBL-2H3 cells (2.5 × 10⁶) expressing the N-terminal HA epitope-tagged IpLITR 2.6b/IpFcRγ-L (a, b) or IpLITR 1.1b (c, d) were cross-linked by treatment with 0.625 µg/ml anti-HA mAb followed by 1.25 µg/ml anti-mouse IgG3 pAb (H+L) for 0, 2, 4, 8, 16, and 32 min at 37°C. Cell lysates were then blotted with either the anti-phospho-p44/p42 MAPK (Erk1/2) (Thr202/Tyr204) (E10) mouse mAb (a, c; top) or anti-p44/p42 MAPK (Erk1/2) (L34F12) mouse mAb (Endo; a, c; bottom) followed by a goat anti-mouse IgG (H+L) HRP-conjugated pAb. Using conditions identical to those described above, cross-linked IpLITR 2.6b/IpFcRγ-L (e, f) or IpLITR 1.1b (g, h) were then blotted with either anti-phospho-Akt (Ser473) (D9E) XP rabbit mAb (e, g; top) or anti-Akt rabbit pAb (Endo; e, g; bottom) followed by a goat anti-mouse IgG (H+L) HRP-conjugated pAb. i-l Parental (i.e. nontransfected) RBL-2H3 cells were also cross-linked as described using anti-HA mAb and their cell lysates were probed for phospho- and endo-ERK1/2 (i, j) or phospho- and endo-Akt (k, l) levels. Band intensity values were obtained by densitometry using ImageJ v1.44 software. Changes in phospho-ERK1/2 levels are reported as fold induction values relative to the untreated RBL-2H3 cells (i.e. 0 min), set to 1.0 as calculated below. Fold induction values of phospho-ERK1 expression in each lane were calculated using the following equation: [(ERK1 densitometry value for the time point/ERK1 value for the time point) × 100]. This value was then divided by the calculated relative fold induction value of ERK1 expression obtained for 0 min (i.e. untreated cells). Grey and white bars represent the relative fold induction values of phospho-ERK1 and phospho-ERK2, respectively. Phospho-Akt band intensity levels were corrected for endogenous Akt levels using the following equation: [(phospho-Akt densitometry value for the time point/endo-Akt value for the time point) × 100]. This corrected value was then converted into a percent change in phospho-Akt values (% ΔpAkt) as follows: [1 - (0 min corrected phospho-Akt value/corrected phospho-Akt value for the time point) × 100]. b, d, f, h, j, l % ΔpAkt values are displayed, including the % ΔpAkt values for cells triggering via their FcεRI using DNP-HSA (i.e. IgE). Results are representative of 2 independent experiments that gave similar results.
Fig. 5
Fig. 5
IpLITR-mediated phagocytosis of antibody-coated microspheres. Transfected cells were incubated with IgG3 mouse antibody- or anti-HA mAb-coated 4.5-µm YG microspheres and, using a flow cytometry-based phagocytosis assay [33], the % phagocytosis of untransfected RBL-2H3 cells, IpLITR 2.6b/IpFcRγ-L-expressing cells, and IpLITR 1.1b-expressing cells was determined (a). Each bar represents the mean % phagocytosis value ± SEM of 6 independent experiments. * p ≤ 0.001 when comparing the % phagocytosis of anti-HA beads vs. IgG3 beads for each group. Following phagocytosis, cells were also examined by confocal microscopy (b-e). DIC (b) and FITC (c) images of IpLITR 1.1b-expressing cells after phagocytosis of 2-µm anti-HA-opsonized microspheres. Cells are also stained with DAPI (nuclei) and FITC-cholera toxin B subunit as a marker for the GM1 ganglioside. The boxes highlight the similar locations of internalized microspheres for the DIC and FITC images. d, e Representative IpLITR 1.1b-expressing RBL-2H3 cells internalizing 4.5-µm anti-HA-coated microspheres are also shown. Consecutive images from top to bottom are serial confocal Z-stack images of the same cell, and the locations of phagocytosed beads are indicated by circles or arrows. These fluorescence confocal images are also stained with DAPI and the FITC-cholera toxin B subunit.
Fig. 6
Fig. 6
Internalization of IpLITRs following antibody-mediated cross-linking. RBL-2H3 cells expressing IpLITR 2.6b/IpFcRγ-L (a) or IpLITR 1.1b (b) were stained with anti-HA mAb (or IgG3 isotype control antibody) and then incubated with the goat anti-mouse IgG Cy5 pAb for 30 min at 4°C or for 10, 20, and 30 min at 37°C prior to examination by confocal microscopy. Each image shows Cy5 staining (top) or DIC with a DAPI/Cy5 merge (bottom). For the +sucrose treatments, cells were preincubated with a 0.2 M hypertonic sucrose solution prior to staining. The staining patterns that we observed after each treatment are shown, and these images are representative of the ∼20 cells that were imaged per treatment group.
Fig. 7
Fig. 7
Cross-linking of IpLITRs induces their association with lipid raft compartments. RBL-2H3 cells expressing IpLITR 1.1b were prestained with FITC-cholera toxin B subunit prior to staining with anti-HA mAb and the goat anti-mouse IgG Cy5 pAb. a From left to right: Cy5, FITC, Cy5/FITC, and DIC/Cy5/FITC/DAPI merged images for IpLITR 1.1b cells incubated at 4°C for 30 min following receptor cross-linking. b, c These images are the same as above but these cells were incubated for 10 and 30 min at 37°C after receptor cross-linking, respectively. The arrows indicate the location of staining predicted to correspond to the location of IpLITR 1.1b-Cy5 colocalizing with the GM1 ganglioside-FITC lipid raft compartments. The staining patterns that we observed after each treatment are shown, and they are representative of the ∼10 cells that were imaged per treatment group.
Fig. 8
Fig. 8
IpLITR 1.1b does not associate with the FcεRIγ chain and requires an intact CYT region for phagocytosis. Untransfected RBL-2H3 cells and those expressing IpLITR 1.1b (∼2.5 × 10⁶) were treated with (+) or without (-) Na3VO4 and then lysed and immunoprecipiated with either 2 µg anti-FcεRI α subunit mouse mAb (a) or anti-HA mAb (b). Immunoprecipitated samples were then blotted with the anti-FcεRIγ rabbit pAb or an anti-FcεRI α rabbit pAb as indicated. Cellular lysates were also blotted with an HRP-conjugated anti-HA antibody (b). As described earlier, the % phagocytosis of untransfected RBL-2H3 cells, IpLITR 1.1b-expressing cells, IpLITR 1.1b ΔCYT-expressing cells, and IpLITR 1.2a-expressing cells was determined (c). Each bar represents the mean % phagocytosis value ± SEM of 4 independent experiments. * p ≤ 0.001 when comparing the % phagocytosis of anti-HA beads vs. IgG3 beads for each group.
Fig. 9
Fig. 9
Effects of EDTA and CytoD on IpLITR 2.6b/IpFcRγ-L- and IpLITR1.1b-mediated phagocytosis of 4.5-µm microspheres. RBL-2H3 cells expressing IpLITR 2.6b/IpFcRγ-L (a, c) or IpLITR 1.1b (b, d) were incubated with IgG3 mouse antibody-coated (white bars) or anti-HA mAb-coated (grey bars) 4.5-µm microspheres for 1 h at 37°C. Incubations were performed in the absence (control) or presence of 2 mM EDTA (a, b) or using cells pretreated for 1 h at 37°C with 10 µM CytoD or the DMSO vehicle control (c, d) prior to analysis by flow cytometry. Each bar represents the mean ± SEM of 3 independent phagocytosis experiments. a, b** p ≤ 0.001 when comparing the % phagocytosis of anti-HA beads by IpLITR 2.6b/IpFcRγ-L-expressing cells with and without 2 mM EDTA; * p ≤ 0.05 when comparing the % phagocytosis of anti-HA beads by IpLITR 1.1b-expressing cells with and without 2 mM EDTA. c, d** p ≤ 0.001 when comparing the % phagocytosis of anti-HA beads by IpLITR-expressing cells pretreated with DMSO or with 10 µM CytoD. Percent inhibition for each treatment were calculated using the following formula: [1 - [EDTA or CytoD values for; (%Phagocytosis HA beads - %Phagocytosis G3 beads)]/[control or DMSO values for; (%Phagocytosis HA beads - %Phagocytosis G3 beads)]] × 100.

Similar articles

Cited by

References

    1. Steevels TAM, Meyaard L. Immune inhibitory receptors: essential regulators of phagocyte function. Eur J Immunol. 2011;41:575–587. - PubMed
    1. Lanier LL. Up on the tightrope: natural killer cell activation and inhibition. Nat Immunol. 2008;9:495–502. - PMC - PubMed
    1. Takai T. Fc receptors and their role in immune regulation and autoimmunity. J Clin Immunol. 2005;25:1–18. - PubMed
    1. Barclay AN. Membrane proteins with immunoglobulin-like domains - a master superfamily of interaction molecules. Semin Immunol. 2003;14:215–223. - PubMed
    1. Weis WI, Taylor ME, Drickamer K. The C-type lectin superfamily in the immune system. Immunol Rev. 1998;163:19–34. - PubMed

Publication types

MeSH terms