. 2014 Aug;28(8):1606-16.
doi: 10.1038/leu.2014.64. Epub 2014 Feb 7.

Molecular profiling of blastic plasmacytoid dendritic cell neoplasm reveals a unique pattern and suggests selective sensitivity to NF-kB pathway inhibition

Collaborators, Affiliations

Molecular profiling of blastic plasmacytoid dendritic cell neoplasm reveals a unique pattern and suggests selective sensitivity to NF-kB pathway inhibition

M R Sapienza et al. Leukemia. 2014 Aug.

Abstract

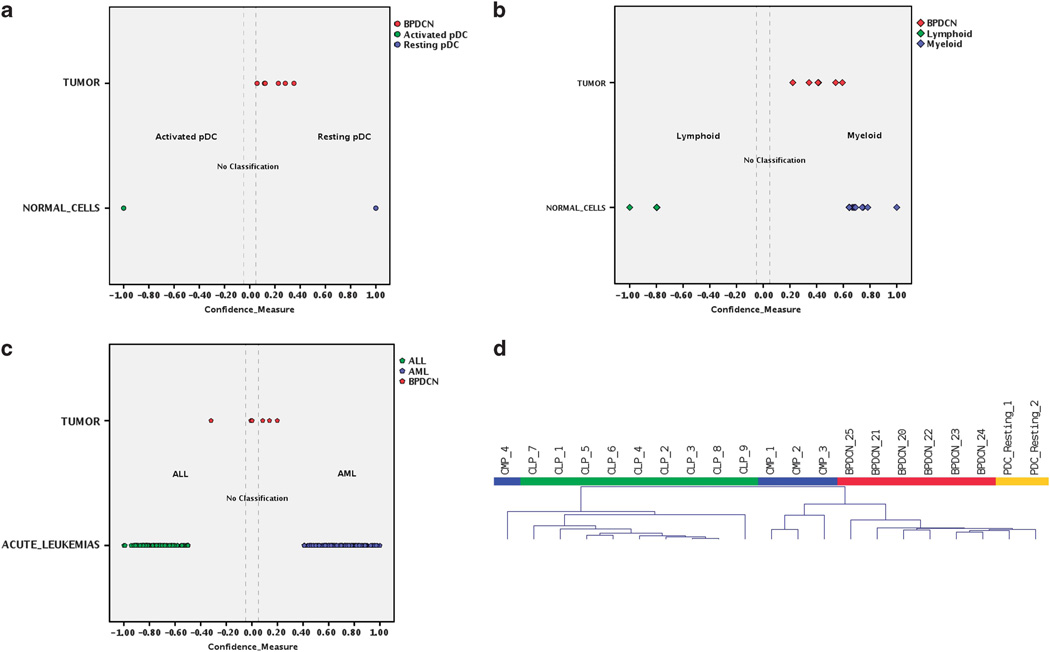
Blastic plasmacytoid dendritic cell neoplasm (BPDCN) is a rare disease of controversial origin recently recognized as a neoplasm deriving from plasmacytoid dendritic cells (pDCs). Nevertheless, it remains an orphan tumor with obscure biology and dismal prognosis. To better understand the pathobiology of BPDCN and discover new targets for effective therapies, the gene expression profile (GEP) of 25 BPDCN samples was analyzed and compared with that of pDCs, their postulated normal counterpart. Validation was performed by immunohistochemistry (IHC), whereas functional experiments were carried out ex vivo. For the first time at the molecular level, we definitely recognized the cellular derivation of BPDCN that proved to originate from the myeloid lineage and in particular, from resting pDCs. Furthermore, thanks to an integrated bioinformatic approach we discovered aberrant activation of the NF-kB pathway and suggested it as a novel therapeutic target. We tested the efficacy of anti-NF-kB-treatment on the BPDCN cell line CAL-1, and successfully demonstrated by GEP and IHC the molecular shutoff of the NF-kB pathway. In conclusion, we identified a molecular signature representative of the transcriptional abnormalities of BPDCN and developed a cellular model proposing a novel therapeutic approach in the setting of this otherwise incurable disease.


Conflict of interest statement

CONFLICT OF INTEREST

The authors declare no conflict of interest.

Figures

Figure 1
Figure 1
Cellular derivation of BPDCN. (a) Cell type classification is used to measure the relatedness of six BPDCNs to pDCs resting, pDCs activated, MPs, LPs, acute myeloid leukemias and ALLs. Scatterplots show the distribution of BPDCNs, normal cells and acute leukemia samples according to their discriminant scores in classification steps: pDCs resting vs pDCs activated (a), MPs vs LPs (b) and acute myeloid leukemias vs ALLs (c). Each case is represented in different color according to its sample type. Cases with discriminant score minor than 0.05 in absolute value falls in no classification area and are considered as unclassified. (d) Unsupervised hierarchical clustering of BPDCN (red), resting pDCs (orange), MPs (blue) and LPs (green) samples based on the expression of top 2500 genes with higher s.d. BPDCN and pDC clustered together in the main branch, close to most MPs, while LPs and a few MPs clustered in the second branch.
Figure 2
Figure 2
Unsupervised hierarchical clustering of the BPDCN training set. (a) Principal component analysis well discriminates between tumors (blue) and controls (red). (b) Unsupervised hierarchical clustering was performed on 14 BPDCN samples (tumors) and four pDCs resting (controls), according to the expression of 5049 genes. In the heat-map, each row represents a gene and each column represents a sample. The color scale illustrates the relative expression level of a gene across all samples: red represents an expression level above the mean, blue represents expression lower than the mean. BPDCN cases (blue) roughly clustered together, scattering among normal pDCs (red).
Figure 3
Figure 3
Supervised analysis of BPDCN. (a) The Volcano plot shows the results of t-test for differential expression in BPDCNs vs pDCs. A total of 142 differentially expressed genes, highlighted in red, were selected according to filtering parameters P-value <0.05, multiple testing correction according to Benjamini–Hochberg and fold change >2. (b) Supervised analysis of BPDCN training set samples based on the identified signature of 142 genes, well distinguished controls in red from tumors in blue. The genes downregulated are reported in blue and the genes upregulated in red. (c) The signature of 142 genes correctly classified all the 11 BPDCN of the test set according to support vector machine algorithm. Hierarchical clustering could clearly separate BPDCN cases (blue) from pDCs (red). In the matrix, each row represents a gene and each column represents a sample. The color scale illustrates the relative expression level of a gene across all samples: red represents an expression level above the mean, blue represents expression lower than the mean. (d) The signature of 142 genes revealed a significant enrichment in selected functional categories according to Gene Ontology (the top ranked cellular pathways according to P-value are shown in the pie chart).
Figure 4
Figure 4
BCL2 expression in BPDCN. (a) Gene expression analysis reported BCL2 to be significantly overexpressed in tumors (blue box) compared with controls (red box). The two blue points represent two tumor outliers. (b) Immunohistochemical assay confirmed the BCL2 negativity of normal pDCs isolated from blood or packed in aggregates in the lymph node (as far as the latter was concerned, pDC aggregates were confirmed by immunostaining for CD123 and BDCA-2, showed in the insets) and the marked BCL2 positivity of BPDCN samples and CAL-1 cell line (Olympus BX41 microscope, Olympus CAMEDIA C-7070 camera; original magnification ×400, colors balanced after acquisition with Adobe Photoshop).
Figure 5
Figure 5
Immunohistochemical validation of NF-kB pathway activation in BPDCN. Immunohistochemical assay reported an evident nucleocytoplasmatic positivity for p50 (c, d), c-Rel (g, h) and RelA (k, l) in CAL-1 cell line and BPDCN patients, as expected upon NF-kB pathway activation (black arrows indicate example of nucleocytoplasmatic positivity). On the contrary, pDCs isolated from blood (a, e, i, m, q) or packed in aggregates in the lymph node (b, f, j, n, r: black arrows indicate positive internal controls for nucleocytoplasmatic positivity) reveal a weak positivity confined to the cytoplasm. The latter finding is observed also at the determination of p52 (o, p) and RelB (s, t), in both BPDCN patients, CAL-1 cell line and normal pDCs. (Olympus BX41 microscope, Olympus CAMEDIA C-7070 camera; original magnification ×400, colors balanced after acquisition with Adobe Photoshop).
Figure 6
Figure 6
Bortezomib induces cell death in CAL-1 cell line. CAL-1 cells were incubated with increasing concentrations of Bortezomib, collected at 24 h and stained with Annexin-V-FITC and propidium iodide (PI) to detect early and late apoptotic cells. As shown in the histogram, CAL-1 cells rapidly died after low doses of Bortezomib. In parallel, CAL-1 cells treated with Bortezomib were stained for BrdU and subjected to flow cytometry analysis. Data are represented in the histogram as percentage of BrdU positive in the total population. Bortezomib induced increases in BrdU incorporation but the cells were gradually arrested in G0/G1 phase as shown by the analysis of cell cycle progression (Navios Flow Cytometers, Beckman Coulter).
Figure 7
Figure 7
Bortezomib inhibits NF-kB canonical pathway in CAL-1 cell line. (a) IHC showed nuclear positivity for RelA in CAL-1 cell line untreated (Crtl). After Bortezomib and BMS-345541 administration, the CAL-1 cells became RelA negative in the nuclei. (b) RELA (p65) expression and phosphorylation by whole cellular extracts of CAL-1 cell line were investigated at 6 h after exposure to Bortezomib (Velcade) 150 nm and BMS-345541 7 µm by western blot. Phospho-RELA was significantly reduced after treatment with bortezomib and completely abolished after BMS-345541. Total RELA was, conversely, increased after bortezomib administration likely due to its stabilization through IkB. Beta-actin served as control for protein loading. Signal intensities in single blots were measured by ChemiDoc-It imaging system. Results presented here have been confirmed in two additional experiments. (c) CAL-1 cells were incubated with 30 nm Bortezomib (IC50) for 6 h and then analyzed by GEP, which revealed a substantial modification of NF-kB signature after Bortezomib administration. CAL-1 cells pre- and post-treatment are shown as ‘CRTL’ and ‘Bortez’, respectively. The genes upregulated are colored in red and the downregulated in blue. (d) Gene set Enrichment Analysis enrichment plot shows that NF-kB signaling is significantly enriched in BPDCN vs pDCs and CAL-1 untreated vs treated. In the enrichment plot the x axis shows the rank order of genes from the most upregulated to the most downregulated between BPDCNs and pDCs and between CAL-1 cell line before and after Bortezomib treatment, respectively. The barcode indicates the position of NF-kB signaling genes in the ranking list. The y axis shows the distribution of the running enrichment score generated by walking down the list of ranked genes. (e) Gene Ontology analysis reported that after Bortezomib administration, the most deregulated pathways according to P-value are involved in cellular communication and response to external stimuli. (f) A support vector machine-based cell classifier classified treated and untreated CAL-1 according to their similarity to normal pDC or primary BPDCN based on the expression of genes modulated by bortezomib.

References

    1. Facchetti FJD, Petrella T. Blastic plasmacytoid dendritic cell neoplasms. In: Swerdlow SH, Campo E, Harris NL, et al., editors. WHO Classification of Tumors of Haematopoietic and Lymphoid Tissues. Lyon, France: IARC; 2008. pp. 145–147.
    1. Assaf C, Gellrich S, Whittaker S, Robson A, Cerroni L, Massone C, et al. CD56-positive haematological neoplasms of the skin: a multicentre study of the Cutaneous Lymphoma Project Group of the European Organisation for Research and Treatment of Cancer. J Clin Pathol. 2007;60:981–989. - PMC - PubMed
    1. Grouard G, Rissoan MC, Filgueira L, Durand I, Banchereau J, Liu YJ. The enigmatic plasmacytoid T cells develop into dendritic cells with interleukin (IL)-3 and CD40-ligand. J Exp Med. 1997;185:1101–1111. - PMC - PubMed
    1. Cella M, Facchetti F, Lanzavecchia A, Colonna M. Plasmacytoid dendritic cells activated by influenza virus and CD40L drive a potent TH1 polarization. Nat Immunol. 2000;1:305–310. - PubMed
    1. Soumelis V, Liu YJ. From plasmacytoid to dendritic cell: morphological and functional switches during plasmacytoid pre-dendritic cell differentiation. Eur J Immunol. 2006;36:2286–2292. - PubMed

Publication types

MeSH terms