. 2014 Feb 4;9(2):e87772.
doi: 10.1371/journal.pone.0087772. eCollection 2014.

Dietary restriction and fasting arrest B and T cell development and increase mature B and T cell numbers in bone marrow

Affiliations

Dietary restriction and fasting arrest B and T cell development and increase mature B and T cell numbers in bone marrow

Shushimita Shushimita et al. PLoS One. .

Abstract

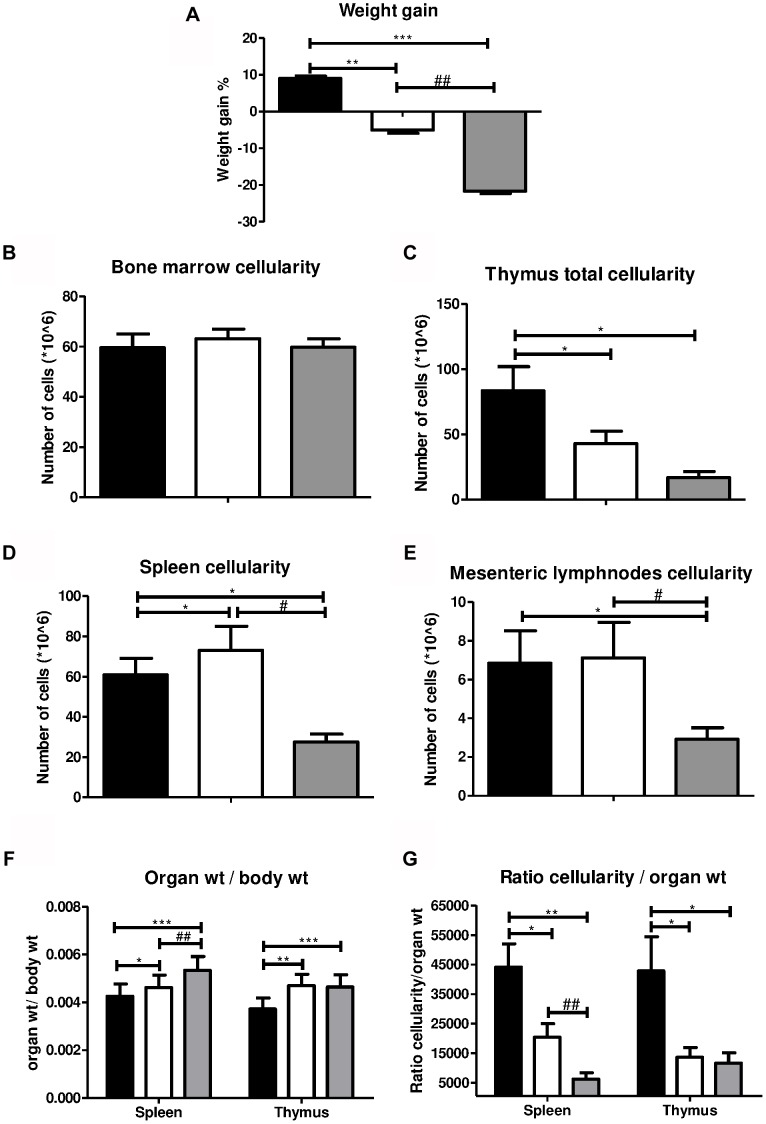
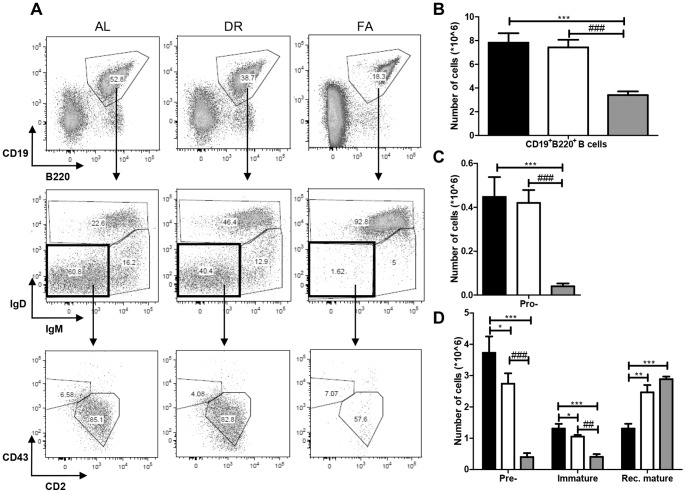
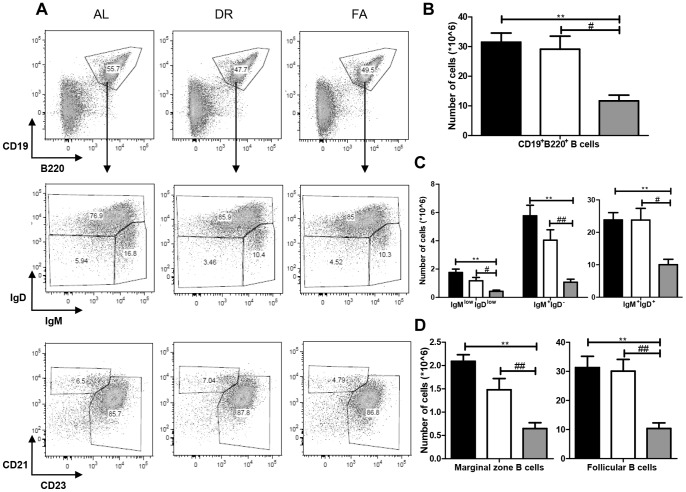
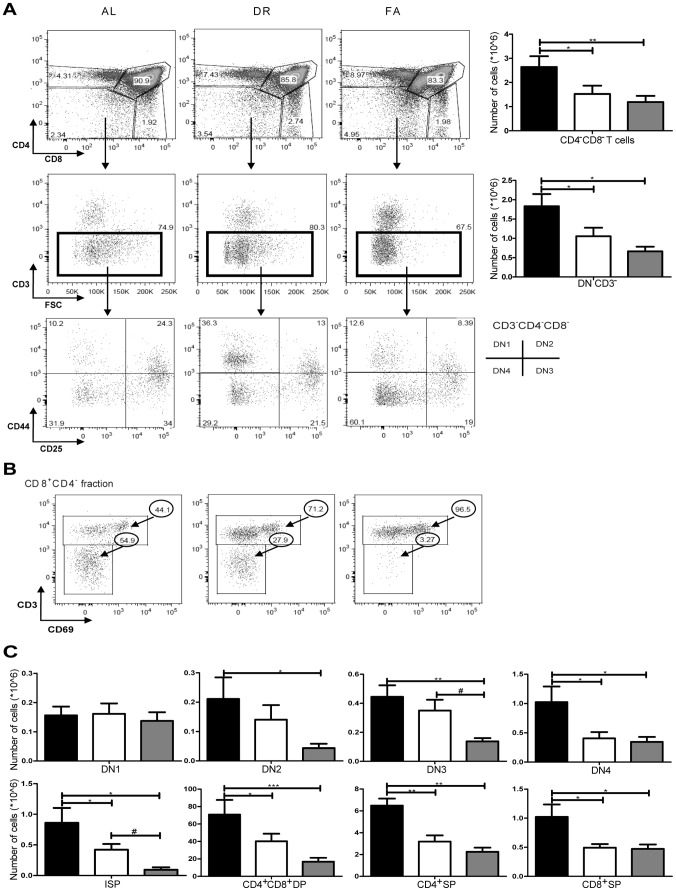
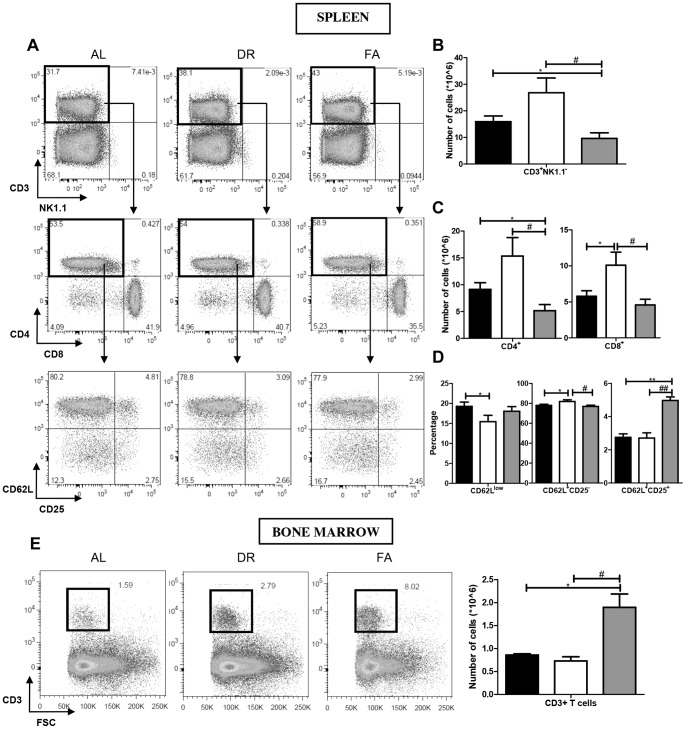
Dietary restriction (DR) delays ageing and extends life span. Both long- and short-term DR, as well as short-term fasting provide robust protection against many "neuronal and surgery related damaging phenomena" such as Parkinson's disease and ischemia-reperfusion injury. The exact mechanism behind this phenomenon has not yet been elucidated. Its anti-inflammatory actions prompted us to thoroughly investigate the consequences of DR and fasting on B and T cell compartments in primary and secondary lymphoid organs of male C57Bl/6 mice. In BM we found that DR and fasting cause a decrease in the total B cell population and arrest early B cell development, while increasing the number of recirculating mature B cells. In the fasting group, a significant reduction in peripheral B cell counts was observed in both spleen and mesenteric lymph nodes (mLN). Thymopoiesis was arrested significantly at double negative DN2 stage due to fasting, whereas DR resulted in a partial arrest of thymocyte development at the DN4 stage. Mature CD3(+) T cell populations were increased in BM and decreased in both spleen and mLN. Thus, DR arrests B cell development in the BM but increases the number of recirculating mature B cells. DR also arrests maturation of T cells in thymus, resulting in depletion of mature T cells from spleen and mLN while recruiting them to the BM. The functional relevance in relation to protection against organ damage needs to be determined.


Conflict of interest statement

Competing Interests: The authors have declared that no competing interests exist.

Figures

Figure 1
Figure 1. The effect of DR and FA on body weight and cellularity of lymphoid organs.
A) Both DR and FA cause a significant reduction body weight while B, C, D, and E show that total cellularity changes take place due to the two dietary interventions. F) shows the ratio of spleen and thymus organ weight to the body weight of the mice. G) shows the ratio of spleen and thymus cellularity to their respective organ weights. Fig. 1A ** = p<0.001, *** = p<0.0005, ## = p<0.001. Fig. 1C, D, and E *, # = p<0.05. Fig. 1F * = p<0.05, **,## = p<0.005, *** = p<0.0001. Fig. 1G * = p<0.05, **,## = p<0.005. n = 8/group. Ad libitum, 2 weeks 30% DR and 3 days fasting groups are represented by black, white and grey box, respectively. BM –1 hind leg.
Figure 2
Figure 2. Effects of dietary restriction on B cell development phenotype in the BM.
A) The first panel of FACS plots represents the plots of CD19 and B220 from the three dietary regimen groups. The second panel shows IgD and IgM populations from CD19+B220+ B cell fraction with IgMIgD populations (pro-B+pre-B cells), IgM+IgDlow (immature B cells) and IgM+/lowIgDhigh (recirculating mature) B cells. The third panel represents the CD43CD2 profiles of IgD IgM- fractions and distinguishes between pro-B (CD43+CD2IgMIgD) and pre-B (CD43CD2+IgMIgD). B) Represents the total B-lineage population (CD19+B220+) in BM. C, D) shows the changes in the B cell development phenotype where both DR and FA cause significant phenotypic alternations in the development stages. Fig. 2B and C *** = p<0.0002, ### = p<0.0004. Fig. 2D *, # = p<0.05, **, ## = p<0.004, *** = p<0.0003. n = 8/group. Ad libitum, 2 weeks 30% DR and 3 days fasting groups are represented by black, white and grey box, respectively.
Figure 3
Figure 3. Effects of dietary restriction on the splenic B cell subtypes.
A) In the first panel, FACS plots of splenic cells plotted against CD19 and B220 in the dietary interventions groups, while the second panel shows the IgM/IgD profiles of gated CD19+B220+ fractions. The third panel represents the CD21/CD23 profiles of the CD19+B220+ fractions. B) Shows the total CD19+B220+ B cell cellularity in spleen. C) Shows that IgMlowIgDlow was significantly affected by FA but not by DR. A similar trend was also observed with respect to cellularity of immature IgM+IgD and mature IgM+IgD+ populations. D) Represents the cellularity changes in CD21+CD23 marginal zone and CD21CD23+ follicular B cells. Fig. 3B ** = p<0.001, # = p<0.05. Fig. 3C # = p<0.05 **, ## = p<0.001. Fig. 3D ** = p<0.002, ## = p<0.005. n = 8/group. Ad libitum, 2 weeks 30% DR and 3 days fasting groups are represented by black, white and grey box, respectively.
Figure 4
Figure 4. Effects of dietary restriction on T cell development phenotype in thymus A) FACS plot of CD4 against CD8 in the first panel and the corresponding CD4CD8 cellularity graph.
The second panel represents the CD3/FSC FACS profiles of CD4CD8 DN fractions along with the corresponding cellularity graph of DN CD3. The third panel of plots shows CD44/CD25 profiles of DN CD3 fraction. This panel shows the DN1-DN4 stages in the dietary intervention groups. B) FACS plots show the expression of CD3/CD69 profiles of CD8+CD4 fractions representing the CD3CD69ISP and CD3+CD8+ SP cells C) The upper and lower panel of graphs show the phenotypic changes taking place during the development stages starting from DN stages to CD3CD69 ISP, CD4+CD8+ DP and CD4+ SP and CD8+ SP. Fig. 4A and C *, # = p<0.05, ** = p<0.001, *** = p<0.007. n = 8/group. Ad libitum, 2 weeks 30% DR and 3 days fasting groups are represented by black, white and grey box, respectively.
Figure 5
Figure 5. Effects of dietary restriction on spleen and BM T cell lymphoid populations.
A) The first panel represents the FACS plot of the total CD3+NK1.1 T cell population in spleen. The second panel of FACS plots show the CD4/CD8 profiles of the gated total CD3+NK1.1 fractions while the third panel of FACS plots represents the CD62L/CD25 profiles of the total CD4+CD8 fractions. B) The graph represents the total CD3+NK1.1 T cell cellularity. C) Shows the total number of CD4+ and CD8+ T cells. D) Shows the percentages of CD62Llow memory T cells, CD62L+CD25 naïve T cells and CD62L+CD25+ Tregs populations. E) Shows the CD3+ T cell changes taking place in BM. Fig. 5B * = p<0.01, # = p<0.05. Fig. 5C *** = p<0.0005. Fig. 5D *,# = p<0.05, **,## = p<0.001. Fig. 5E *,# = p<0.02. n = 8/group. Ad libitum, 2 weeks 30% DR and 3 days fasting groups are represented by black, white and grey box, respectively.

References

    1. McCay CM, Crowell MF, Maynakd LA (1935) The Effect of Retarded Growth Upon The Length of Life Span and Upon the Ultimate Body Size. The journal of Nutrition: 63–79. - PubMed
    1. Mair W, Dillin A (2008) Aging and Survival: The Genetics of Life Span Extension by Dietary Restriction. Annu Rev Biochem 77: 727–754. - PubMed
    1. Koubova J, Guarente L (2003) How does calorie restriction work? Genes Dev 17: 313–321. - PubMed
    1. Heilbronn LK, de Jonge L, Frisard MI, DeLany JP, Larson-Meyer DE, et al. (2006) Effect of 6-mo. calorie restriction on biomarkers of longevity, metabolic adaptation and oxidative stress in overweight subjects. JAMA 295: 1539–1548. - PMC - PubMed
    1. Goodrick CL, Ingram DK, Reynolds MA, Freeman JR, Cider N (1990) Effects of intermittent feeding upon body weight and lifespan in inbred mice: interaction of genotype and age. Mech Ageing Dev 55: 69–87. - PubMed

Publication types

MeSH terms

LinkOut - more resources