. 2014 Feb 21;59(4):925-49.
doi: 10.1088/0031-9155/59/4/925. Epub 2014 Feb 7.

MAP reconstruction for Fourier rebinned TOF-PET data

Affiliations

MAP reconstruction for Fourier rebinned TOF-PET data

Bing Bai et al. Phys Med Biol. .

Abstract

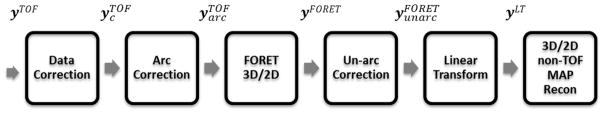
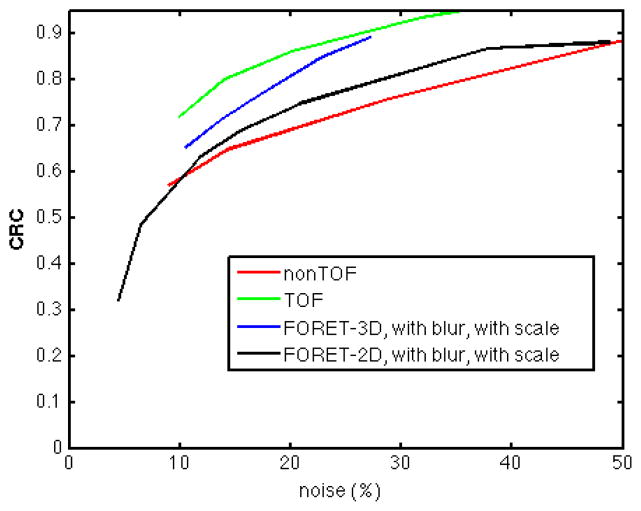
Time-of-flight (TOF) information improves the signal-to-noise ratio in positron emission tomography (PET). The computation cost in processing TOF-PET sinograms is substantially higher than for nonTOF data because the data in each line of response is divided among multiple TOF bins. This additional cost has motivated research into methods for rebinning TOF data into lower dimensional representations that exploit redundancies inherent in TOF data. We have previously developed approximate Fourier methods that rebin TOF data into either three-dimensional (3D) nonTOF or 2D nonTOF formats. We refer to these methods respectively as FORET-3D and FORET-2D. Here we describe maximum a posteriori (MAP) estimators for use with FORET rebinned data. We first derive approximate expressions for the variance of the rebinned data. We then use these results to rescale the data so that the variance and mean are approximately equal allowing us to use the Poisson likelihood model for MAP reconstruction. MAP reconstruction from these rebinned data uses a system matrix in which the detector response model accounts for the effects of rebinning. Using these methods we compare the performance of FORET-2D and 3D with TOF and nonTOF reconstructions using phantom and clinical data. Our phantom results show a small loss in contrast recovery at matched noise levels using FORET compared to reconstruction from the original TOF data. Clinical examples show FORET images that are qualitatively similar to those obtained from the original TOF-PET data but with a small increase in variance at matched resolution. Reconstruction time is reduced by a factor of 5 and 30 using FORET3D+MAP and FORET2D+MAP respectively compared to 3D TOF MAP, which makes these methods attractive for clinical applications.


Figures

Figure 1
Figure 1
Flow chart for MAP reconstruction using FORET rebinned data.
Figure 2
Figure 2
Histogram of the ratio of the variance of the unweighted LS and diagonal WLS solutions.
Figure 3
Figure 3
Sample blur kernel used for FORET-3D rebinned data, from left to right: larger radial displacement to smaller radial displacement.
Figure 4
Figure 4
Profiles of selected point source sinograms, from left to right: larger radial displacement to smaller radial displacement. 0 represents the center of the scanner.
Figure 5
Figure 5
Comparison of sample variance from Monte Carlo simulation and estimated from (12), angle index=100, sinogram index=5. Left: FORET-3D, Right: FORET-2D.
Figure 6
Figure 6
Histogram of variance to mean ratios of FORET after the affine transform in (13) at which point the mean and variance should be equal. Only the sinogram elements within the object region was plotted. Left: FORET-3D, Right: FORET-2D. The modes are 0.995 for FORET-3D and 1.01 for FORET-2D
Figure 7
Figure 7
Comparison of different approximations for computing variance in FORET-2D. See text for explanation.
Figure 8
Figure 8
Variance reduction factor KF2D(z) (see Appendix, (35)) for FORET-2D as a function of axial position compared to variance reduction calculated by Monte Carlo simulation.
Figure 9
Figure 9
Resolution vs. β calibration table generated from simulated point source data for the Siemens mCT scanner for each of the four different data representations used in subsequent studies.
Figure 10
Figure 10
Left: true phantom. Right: Reconstructed images. Images in the top row are reconstructed from FORET rebinned sinogram directly. Images in the bottom row are from rescaled data using accurate mean and variance of the rebinned data and quasi-Poisson noise model. From left to right the target resolution are 6mm, 7mm and 8mm respectively. The red circle indicates the ROI used for noise measurements
Figure 11
Figure 11
CRC vs. noise. (a) Noise measured using variance of the mean of ROI from Monte Carlo simulation; (b) noise measured using ROI variance from one sample reconstruction. Dashed curves are from rescaled data using accurate mean and variance of rebinned data, solid curves are from rebinned data directly.
Figure 12
Figure 12
Sample reconstructed phantom images using different data formats. Upper left: TOF, upper right: nonTOF, lower left: FORET-2D, lower right: FORET-3D.
Figure 13
Figure 13
CRC vs. noise curves of images reconstructed from TOF, nonTOF, FORET-3D and FORET-2D data.
Figure 14
Figure 14
CRC vs. noise curves of images reconstructed from (a) FORET-3D; (b) FORET-2D.
Figure 15
Figure 15
Comparison of whole-body patient images. From left to right: nonTOF, FORET-2D, FORET-3D, TOF. All images have resolution of 6mm.
Figure 16
Figure 16
Noise reduction factors due to arc correction.
Figure 17
Figure 17
K2D(s, ϕ, z) for the central slice in the scanner shown in linear (left) and log scale (right). Horizontal axis: angle, ϕ; vertical axis: radial coordinate, s.

References

    1. Ahn S, Cho S, Li Q, Lin Y, Leahy R. Optimal rebinning of time-of-flight pet data. Medical Imaging, IEEE Transactions on. 2011;30(10):1808–1818. - PMC - PubMed
    1. Alessio A, Sauer K, Kinahan P. Statistical image reconstruction from correlated data with applications to pet. Physics in Medicine and Biology. 2007;52:6133–6150. - PMC - PubMed
    1. Anger H. Technical report. Univ. of California; Berkeley: 1966. Survey of radioisotope cameras.
    1. Casey ME, Gadagkar H, Newport D. A component based method for normalization in volume pet. 3rd Int. Meeting on Fully Three-Dimensional Image Reconstruction in Radiology and Nuclear Medicine; IEEE; 1995. pp. 67–71.
    1. Chatziioannou A, Qi J, Moore A, Annala A, Nguyen K, Leahy R, Cherry S. Comparison of 3-d maximum a posteriori and filtered backprojection algorithms for high-resolution animal imaging with micropet. Medical Imaging, IEEE Transactions on. 2000;19(5):507–512. - PubMed

Publication types

MeSH terms