. 2014 Apr;7(4):471-81.
doi: 10.1242/dmm.014126. Epub 2014 Feb 6.

Denervation atrophy is independent from Akt and mTOR activation and is not rescued by myostatin inhibition

Affiliations

Denervation atrophy is independent from Akt and mTOR activation and is not rescued by myostatin inhibition

Elizabeth M MacDonald et al. Dis Model Mech. 2014 Apr.

Abstract

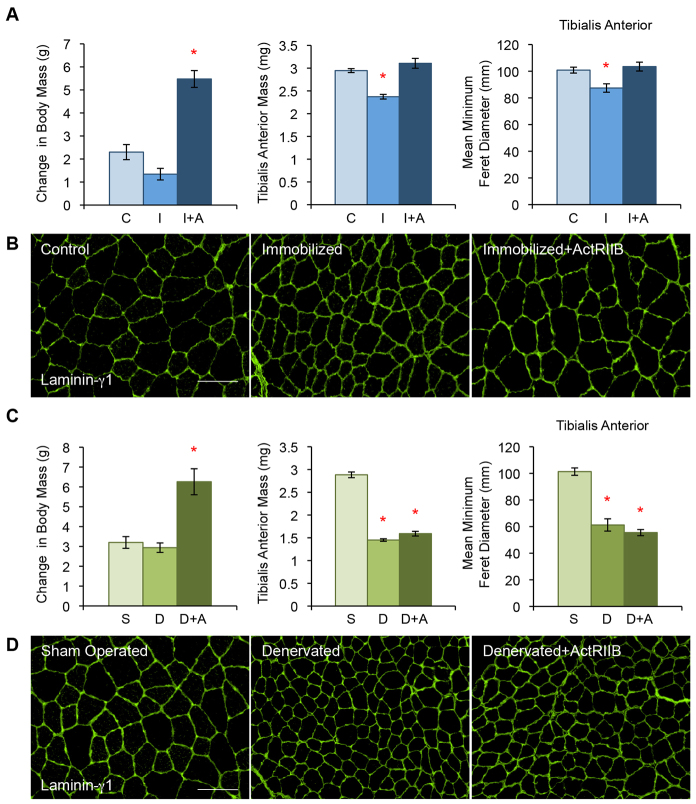
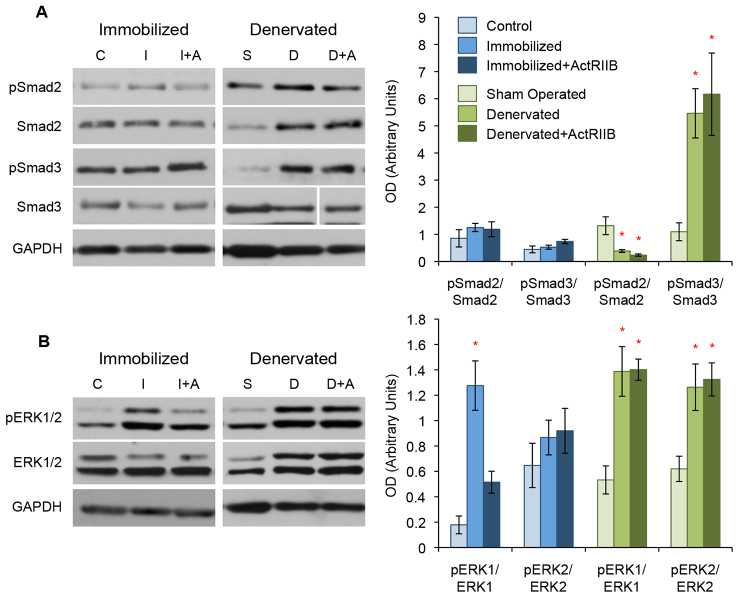
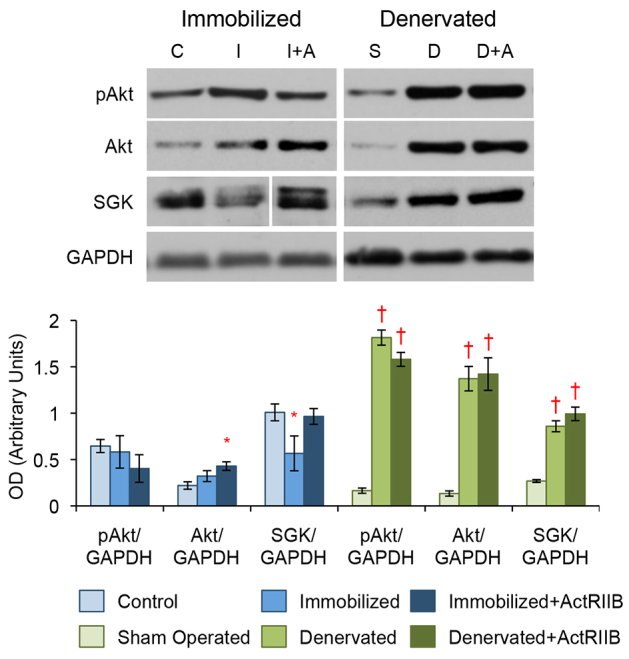
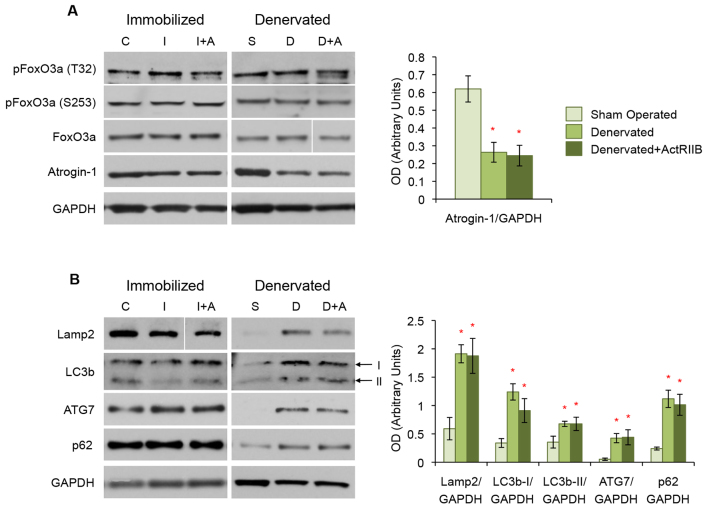
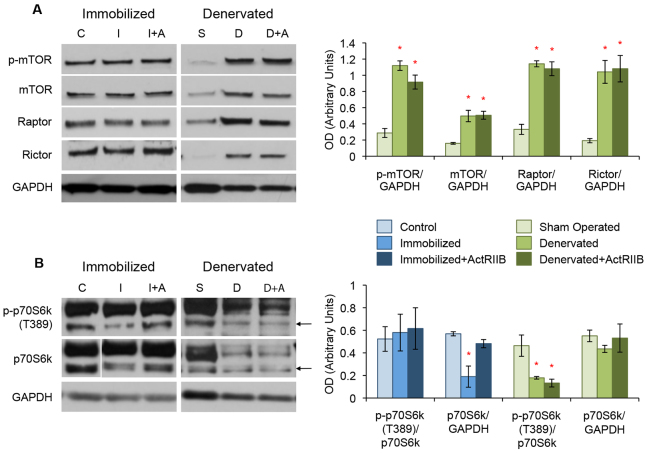
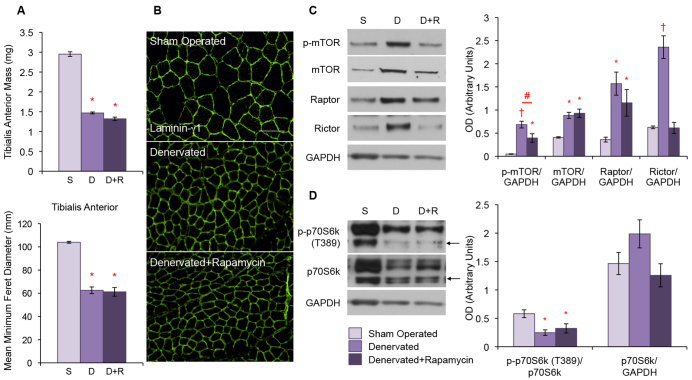
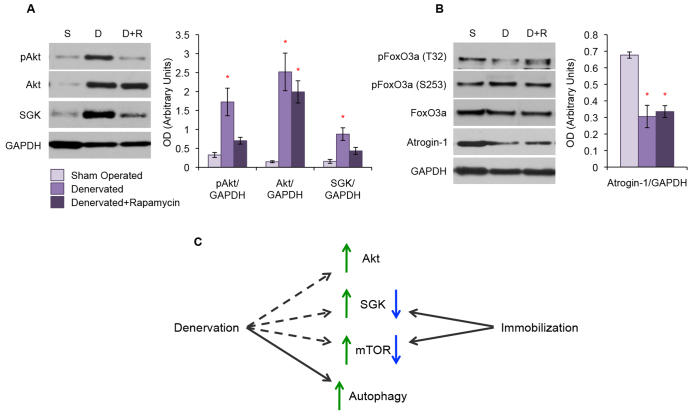
The purpose of our study was to compare two acquired muscle atrophies and the use of myostatin inhibition for their treatment. Myostatin naturally inhibits skeletal muscle growth by binding to ActRIIB, a receptor on the cell surface of myofibers. Because blocking myostatin in an adult wild-type mouse induces profound muscle hypertrophy, we applied a soluble ActRIIB receptor to models of disuse (limb immobilization) and denervation (sciatic nerve resection) atrophy. We found that treatment of immobilized mice with ActRIIB prevented the loss of muscle mass observed in placebo-treated mice. Our results suggest that this protection from disuse atrophy is regulated by serum and glucocorticoid-induced kinase (SGK) rather than by Akt. Denervation atrophy, however, was not protected by ActRIIB treatment, yet resulted in an upregulation of the pro-growth factors Akt, SGK and components of the mTOR pathway. We then treated the denervated mice with the mTOR inhibitor rapamycin and found that, despite a reduction in mTOR activation, there is no alteration of the atrophy phenotype. Additionally, rapamycin prevented the denervation-induced upregulation of the mTORC2 substrates Akt and SGK. Thus, our studies show that denervation atrophy is not only independent from Akt, SGK and mTOR activation but also has a different underlying pathophysiological mechanism than disuse atrophy.

Keywords: Denervation atrophy; Muscle atrophy pathophysiology; Myostatin; Skeletal muscle; TGF-β signaling.


Figures

Fig. 1.
Fig. 1.
Myostatin inhibition prevents disuse, but not denervation, atrophy. (A,C) ActRIIB treatment leads to an increase in body mass for both the immobilization (‘I+A’) (*P<5.0×10⁻⁸) and denervation (‘D+A’) (*P<1.0×10⁻⁴) models (panels A and C, respectively, left graph). (A) The TA mass of immobilized (‘I’) mice is significantly lower than controls (‘C’) (*P<1.0×10⁻⁸); however, no loss of muscle mass is seen in ActRIIB-treated immobilized mice (center graph). MFD quantification of the fiber size of immobilized TA muscle (A, right graph) confirmed visual analysis by laminin-γ1 staining (B) that the immobilized mice lose fiber size (*P<1.0×10⁻²) but not when treated with ActRIIB. (C) The denervated TA muscle (‘D’) is significantly smaller than sham-operated controls (‘S’) (*P<5.0×10⁻¹⁵) and this is not prevented by ActRIIB treatment (center graph). MFD quantification (C, right graph) and visual analysis (D) showed that both the denervated and denervated with ActRIIB treatment lose the same amount of muscle fiber diameter over the course of the treatment (*P<1.0×10⁻⁴). Data are represented as mean ±s.e.m. *P-values indicate significant differences with respect to controls. Scale bars: 100 μm.
Fig. 2.
Fig. 2.
ActRIIB treatment targets non-canonical TGF-β signaling markers in disuse atrophy. Western blot analysis of TA muscle protein lysates. (A) Immobilization alone (‘I’) or with ActRIIB treatment (‘I+A’) did not show any difference in pSmad2 or pSmad3 levels compared with controls (‘C’). Denervation alone (‘D’) induced a significant increase in total Smad2 and active pSmad3 compared with sham-operated controls (‘S’); however, those changes are not reduced by ActRIIB treatment (‘D+A’). (B) Both immobilization and denervation resulted in an upregulation in active pERK1/2. ActRIIB treatment prevented the upregulation of pERK1/2 in immobilized but not denervated muscle. Quantitative analysis of blots is displayed in the graphs (right) with arbitrary units of mean ± s.e.m. *P<5.0×10⁻² with respect to controls. Lines indicate where intervening lanes have been removed from a single image to show the most representative band for that treatment group.
Fig. 3.
Fig. 3.
Loss of SGK, but not Akt, is observed in disuse atrophy, but upregulation of both occurs in denervation atrophy. Western blot analysis of TA muscle protein lysates. No change in active pAkt is seen between the control (‘C’), immobilized (‘I’) and immobilized with ActRIIB treatment (‘I+A’) groups. Total Akt is increased in immobilized mice treated with ActRIIB compared with controls. SGK expression is decreased with immobilization, but not when mice are treated with ActRIIB. Both denervation alone (‘D’) and with ActRIIB treatment (‘D+A’) lead to a substantial upregulation in active pAkt, total Akt and SGK when compared with sham-operated controls (‘S’). Quantitative analysis of blots is displayed in the graph (below) with arbitrary units of mean ± s.e.m. *P<5.0×10⁻² and P<5.0×10⁻⁵ with respect to controls. Lines indicate where intervening lanes have been removed from a single image to show the most representative band for that treatment group.
Fig. 4.
Fig. 4.
Autophagy plays a significant role in denervation, but not disuse, atrophy. Western blot analysis of TA muscle protein lysates. (A) Phosphorylation and total expression of FoxO3a did not change between the control (‘C’), immobilized (‘I’) and immobilized with ActRIIB treatment (‘I+A’) groups. In addition, with or without ActRIIB treatment, immobilization did not change the expression of the FoxO3a target atrogin-1. Similarly, no change was seen between the sham-operated (‘S’), denervated (‘D’) and ActRIIB-treated denervated (‘D+A’) mice in FoxO3a phosphorylation or total expression. Denervated and denervated with ActRIIB mice did, however, show a decrease in atrogin-1 levels compared with sham-operated controls. (B) Markers of autophagy were not different in placebo- and ActRIIB-treated immobilized mice when compared with controls. Denervation alone resulted in an upregulation in Lamp2, LC3b, ATG7 and p62 that was not changed further by ActRIIB treatment. Quantitative analysis of blots is displayed in the graphs (right) with arbitrary units of mean ± s.e.m. *P<5.0×10⁻² with respect to controls. Lines indicate where intervening lanes have been removed from a single image to show the most representative band for that treatment group.
Fig. 5.
Fig. 5.
Dysregulation of mTOR signaling in both disuse and denervation atrophy. Western blot analysis of TA muscle protein lysates. (A) Expression levels of the components of the mTOR complexes, including p-mTOR, total mTOR, raptor and rictor, were not different between control (‘C’), immobilized (‘I’) and ActRIIB-treated immobilized (‘I+A’) mice. Denervation (‘D’) and denervation with ActRIIB treatment (‘D+A’) led to a substantial increase in p-mTOR, total mTOR, raptor and rictor when compared with sham-operated controls (‘S’). (B) Immobilization resulted in a decrease of p70S6k expression but not when the mice were treated with ActRIIB. Denervation led to a decrease in active phosphorylation of p70S6k with no loss of total protein expression and this was not prevented by treatment with ActRIIB. Quantitative analysis of blots is displayed in the graphs (right) with arbitrary units of mean ± s.e.m. *P<5.0×10⁻² with respect to controls. Lines indicate where intervening lanes have been removed from a single image to show the most representative band for that treatment group. Arrows in B indicate the correct size of p70S6k.
Fig. 6.
Fig. 6.
Rapamycin treatment does not change the denervation atrophy phenotype but does reduce mTOR activation. Denervation alone (‘D’) and with rapamycin treatment (‘D+R’) resulted in a significant loss of TA mass when compared with sham-operated controls (‘S’) (*P<5.0×10⁻¹²) (A; top graph). MFD analysis (A; bottom graph) and laminin-γ1 staining (B) showed that placebo- and rapamycin-treated denervated muscle both had significantly reduced muscle fiber diameter (*P<1.0×10⁻⁶). Scale bar: 100 μm. (C) Western blot analysis of TA muscle protein lysates. Denervation alone resulted in an upregulation of p-mTOR, total mTOR, raptor and rictor. Denervated mice treated with rapamycin also showed an upregulation of mTOR and p-mTOR; however, the upregulation of p-mTOR was significantly less than placebo-treated mice (#P<5.0×10⁻²). There was a trend towards reduced expression of raptor with rapamycin treatment in denervated muscle. Rictor levels were not elevated in denervated mice treated with rapamycin compared with sham-operated controls. (D) Loss of the active phosphorylation of p70S6k was seen in placebo- and rapamycin-treated denervated mice despite there being no change in total p70S6k expression. Quantitative analysis of blots is displayed in the graphs (right) with arbitrary units of mean ± s.e.m. For western blots, *P<5.0×10⁻² and P<5.0×10⁻⁴. All P-values indicate a difference with respect to controls unless otherwise noted.
Fig. 7.
Fig. 7.
Rapamycin treatment prevents upregulation of Akt and SGK in denervated muscle. Western blot analysis of TA muscle protein lysates. (A) Denervation (‘D’) resulted in the upregulation of active pAkt, total Akt and SGK when compared with sham-operated controls (‘S’). The upregulation of active pAkt and SGK was not seen in denervated mice treated with rapamycin (‘D+R’). (B) Phosphorylation and expression of FoxO3a was unchanged between the denervation treatment groups. Denervation resulted in a decrease in atrogin-1 expression and this was not changed by rapamycin treatment. Quantitative analysis of blots is displayed in the graphs (right) with arbitrary units of mean ± s.e.m. *P<5.0×10⁻³ with respect to controls. (C) Diagram showing markers that are altered due to either disuse or denervation atrophy. Dashed lines indicate that denervation atrophy results in increased activation of these markers, yet they do not contribute to the pathological phenotype.

References

    1. Andres-Mateos E., Brinkmeier H., Burks T. N., Mejias R., Files D. C., Steinberger M., Soleimani A., Marx R., Simmers J. L., Lin B., et al. (2013). Activation of serum/glucocorticoid-induced kinase 1 (SGK1) is important to maintain skeletal muscle homeostasis and prevent atrophy. EMBO Mol. Med. 5, 80–91 - PMC - PubMed
    1. Aoyama T., Matsui T., Novikov M., Park J., Hemmings B., Rosenzweig A. (2005). Serum and glucocorticoid-responsive kinase-1 regulates cardiomyocyte survival and hypertrophic response. Circulation. 111, 1652–1659 - PubMed
    1. Baumann A. P., Ibebunjo C., Grasser W. A., Paralkar V. M. (2003). Myostatin expression in age and denervation-induced skeletal muscle atrophy. J. Musculoskelet. Neuronal Interact. 3, 8–16 - PubMed
    1. Bodine S. C., Latres E., Baumhueter S., Lai V. K., Nunez L., Clarke B. A., Poueymirou W. T., Panaro F. J., Na E., Dharmarajan K., et al. (2001a). Identification of ubiquitin ligases required for skeletal muscle atrophy. Science. 294, 1704–1708 - PubMed
    1. Bodine S. C., Stitt T. N., Gonzalez M., Kline W. O., Stover G. L., Bauerlein R., Zlotchenko E., Scrimgeour A., Lawrence J. C., Glass D. J., et al. (2001b). Akt/mTOR pathway is a crucial regulator of skeletal muscle hypertrophy and can prevent muscle atrophy in vivo. Nat. Cell Biol. 3, 1014–1019 - PubMed

Publication types

MeSH terms