

A new conversation between radiology and pathology-identifying microvascular architecture in stages of cirrhosis via diffraction enhanced imaging in vitro
- PMID: 24504507
- PMCID: PMC3913676
- DOI: 10.1371/journal.pone.0087957
A new conversation between radiology and pathology-identifying microvascular architecture in stages of cirrhosis via diffraction enhanced imaging in vitro
Abstract
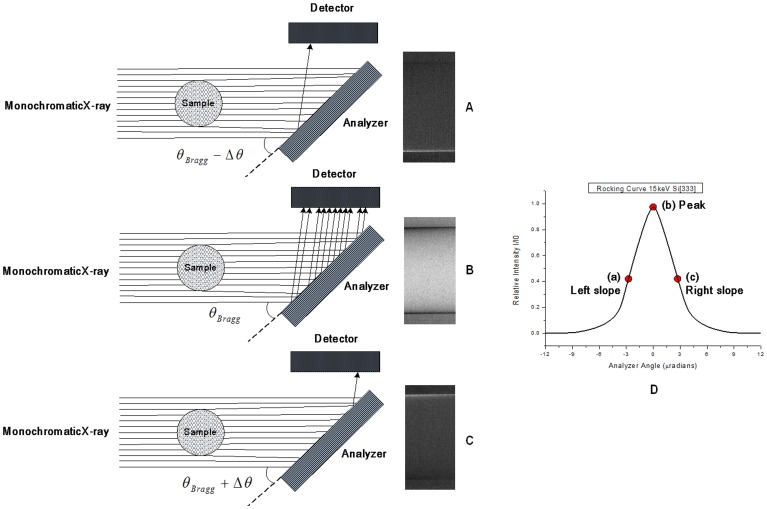
Background/aim: Diffraction enhanced imaging (DEI) is a synchrotron radiation X-ray phase-contrast imaging technique that can better reveal the microstructure of biological soft tissues than conventional X-rays. The aim of this study is to investigate the angio-architectural changes of the liver during fibrosis, cirrhosis and its subsequent regression by applying synchrotron radiation based DEI.
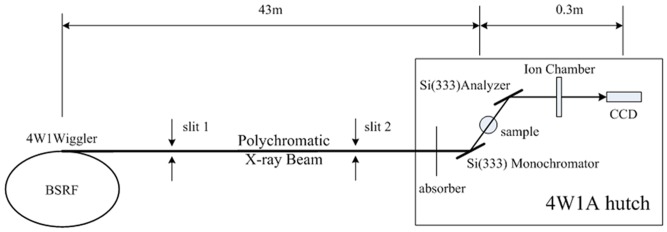
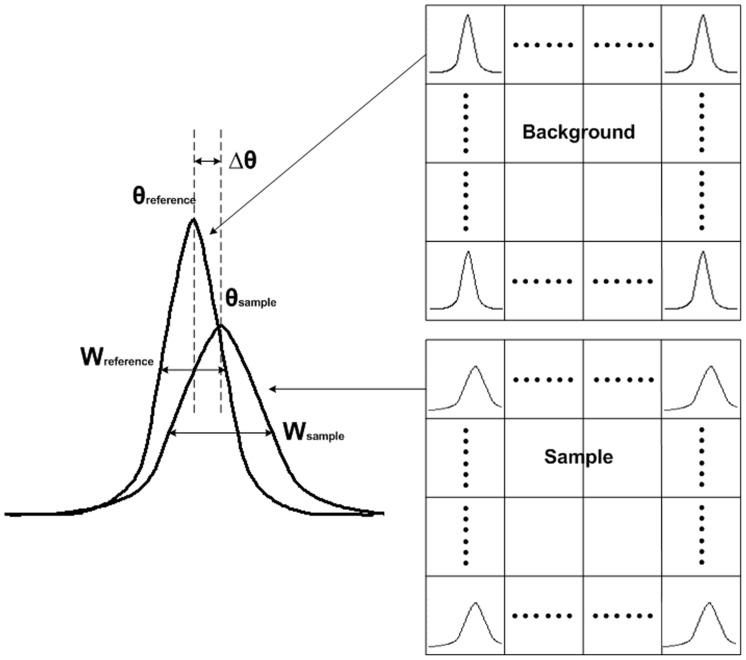
Methods: DEI experiments were performed at the 4W1A station of Beijing Synchrotron Radiation Facility. Twenty-four Sprague-Dawley rats were induced with liver fibrosis by carbon tetrachloride (CCl4) for up to 10 weeks, after which spontaneous regression started and continued until week 30. Quantitative analysis of the DEI images yielded the mean vascular density and intercapillary distance, which was then re-confirmed by immunohistochemical analysis of CD34.
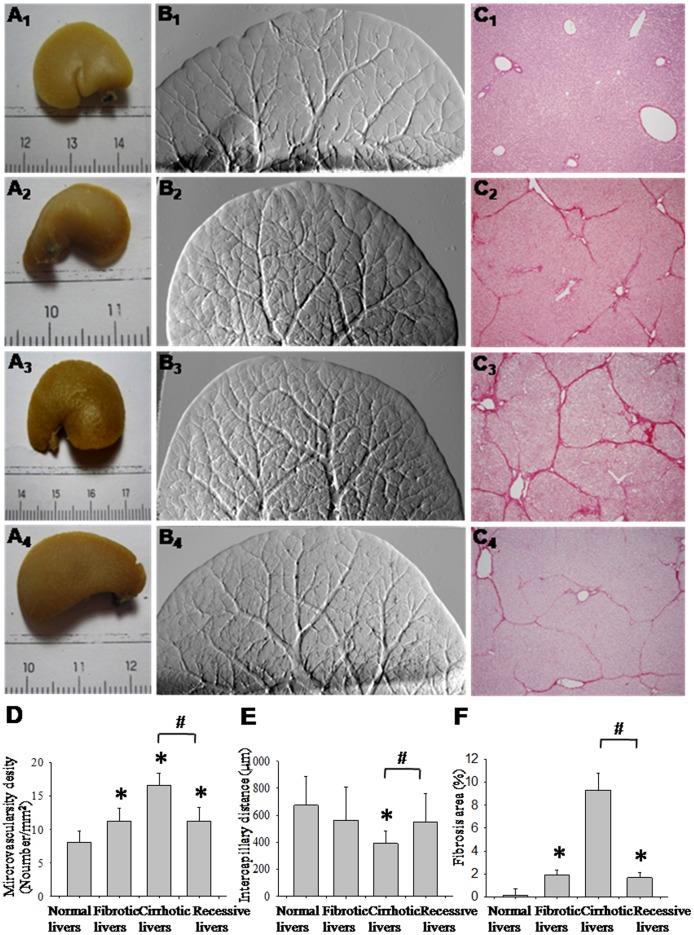
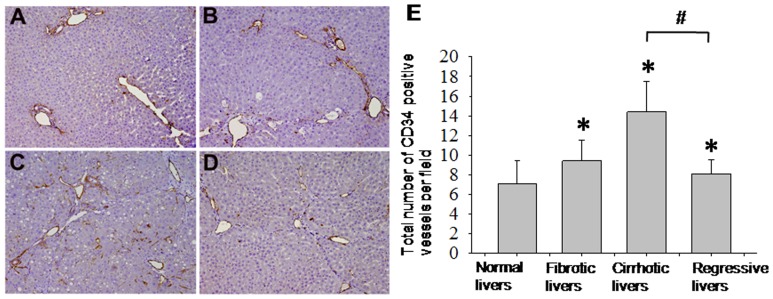
Results: Based on the DEI results, the mean vascular density was 1.4-fold higher in fibrotic rats (at week 6) and 2-fold higher in cirrhotic rats (at week 10) compared with the control (p<0.05). Accordingly, the intercapillary distance decreased to 563.89 ± 243.35 µm in fibrotic rats and 392.90 ± 92.68 µm in cirrhotic rats compared with 673.85 ± 214.16 µm in the control (p<0.05). During fibrosis regression at week 30, vascular density was 0.7-fold lower and intercapillary distance increased to 548.60 ± 210.94 µm as compared with cirrhotic rats (p<0.05).In parallel to the DEI results, immunohistochemical analysis of CD34 showed similar changes.
Conclusion: Synchrotron-based DEI can conduct radiological as well as pathological analysis. Our results are consistent with previous reports indicating that angiogenesis is directly proportional to fibrosis progression. Furthermore, by clarifying the vascular characteristics of liver diseases, DEI reveals that cirrhosis cannot fully reverse during fibrosis regression.
Conflict of interest statement
Figures
Similar articles
-
[Investigation on diagnosing hepatic fibrosis with X-ray diffraction-enhanced imaging].Beijing Da Xue Xue Bao Yi Xue Ban. 2018 Oct 18;50(5):899-904. Beijing Da Xue Xue Bao Yi Xue Ban. 2018. PMID: 30337755 Chinese.
-
Visualizing the hepatic vascular architecture using superb microvascular imaging in patients with hepatitis C virus: A novel technique.World J Gastroenterol. 2016 Jul 14;22(26):6057-64. doi: 10.3748/wjg.v22.i26.6057. World J Gastroenterol. 2016. PMID: 27468197 Free PMC article.
-
Synchrotron radiation (SR) diffraction enhanced imaging (DEI) of chronic glomerulonephritis (CGN) mode.J Xray Sci Technol. 2016;24(1):145-59. doi: 10.3233/XST-160534. J Xray Sci Technol. 2016. PMID: 26890903
-
Microcomputed tomography with diffraction-enhanced imaging for morphologic characterization and quantitative evaluation of microvessel of hepatic fibrosis in rats.PLoS One. 2013 Oct 21;8(10):e78176. doi: 10.1371/journal.pone.0078176. eCollection 2013. PLoS One. 2013. PMID: 24205147 Free PMC article.
-
[Application research of DEI technique based on synchrotron X-ray source in imaging rabbit eyeball in vitro].Zhonghua Yi Xue Za Zhi. 2010 Mar 23;90(11):777-81. Zhonghua Yi Xue Za Zhi. 2010. PMID: 20627026 Chinese.
Cited by
-
3D analysis of microvasculature in murine liver fibrosis models using synchrotron radiation-based microtomography.Angiogenesis. 2021 Feb;24(1):57-65. doi: 10.1007/s10456-020-09751-9. Epub 2020 Oct 10. Angiogenesis. 2021. PMID: 33037487 Free PMC article.
-
Three-dimensional visualization of the microvasculature of bile duct ligation-induced liver fibrosis in rats by x-ray phase-contrast imaging computed tomography.Sci Rep. 2015 Jul 27;5:11500. doi: 10.1038/srep11500. Sci Rep. 2015. PMID: 26212186 Free PMC article.
-
High-resolution 3D visualization of ductular proliferation of bile duct ligation-induced liver fibrosis in rats using x-ray phase contrast computed tomography.Sci Rep. 2017 Jun 26;7(1):4215. doi: 10.1038/s41598-017-03993-2. Sci Rep. 2017. PMID: 28652608 Free PMC article.
-
Assessment of fibrotic tissue and microvascular architecture by in-line phase-contrast imaging in a mouse model of liver fibrosis.Eur Radiol. 2016 Sep;26(9):2947-55. doi: 10.1007/s00330-015-4173-6. Epub 2016 Jan 19. Eur Radiol. 2016. PMID: 26787604
-
Acoustic Radiation Force Impulse (ARFI) Elastography and Serological Markers in Assessment of Liver Fibrosis and Free Portal Pressure in Patients with Hepatitis B.Med Sci Monit. 2017 Jul 23;23:3585-3592. doi: 10.12659/msm.905896. Med Sci Monit. 2017. PMID: 28735336 Free PMC article.
References
-
- Sorensen HT, Thulstrup AM, Mellemkjar L, Jepsen P, Christensen E, et al. (2003) Long-term survival and cause-specific mortality in patients with cirrhosis of the liver: a nationwide cohort study in Denmark. J Clin Epidemiol 56: 88–93. - PubMed
-
- Zois CD, Baltayiannis GH, Karayiannis P, Tsianos EV (2008) Systematic review: hepatic fibrosis - regression with therapy. Aliment Pharmacol Ther 28: 1175–1187. - PubMed
-
- Valfre dBL, Novo E, Cannito S, Busletta C, Paternostro C, et al. (2009) Angiogenesis and liver fibrogenesis. Histol Histopathol 24: 1323–1341. - PubMed
-
- Fernandez M, Semela D, Bruix J, Colle I, Pinzani M, et al. (2009) Angiogenesis in liver disease. J Hepatol 50: 604–620. - PubMed
-
- Coulon S, Heindryckx F, Geerts A, Van Steenkiste C, Colle I, et al. (2011) Angiogenesis in chronic liver disease and its complications. Liver Int 31: 146–162. - PubMed
Publication types
MeSH terms
Substances
LinkOut - more resources
Full Text Sources
Other Literature Sources
Medical
