Cytochrome b divergence between avian sister species is linked to generation length and body mass
- PMID: 24505250
- PMCID: PMC3914784
- DOI: 10.1371/journal.pone.0085006
Cytochrome b divergence between avian sister species is linked to generation length and body mass
Abstract
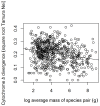
It is increasingly realised that the molecular clock does not tick at a constant rate. Rather, mitochondrial mutation rates are influenced by factors such as generation length and body mass. This has implications for the use of genetic data in species delimitation. It could be that speciation, as recognised by avian taxonomists, is associated with a certain minimum genetic distance between sister taxa, in which case we would predict no difference in the cytochrome b divergence of sister taxa according to the species' body size or generation time. Alternatively, if what taxonomists recognise as speciation has tended to be associated with the passage of a minimum amount of time since divergence, then there might be less genetic divergence between sister taxa with slower mutation rates, namely those that are heavier and/or with longer generation times. After excluding non-flying species, we analysed a database of over 600 avian sister species pairs, and found that species pairs with longer generation lengths (which tend to be the larger species) showed less cytochrome b divergence. This finding cautions against using any simple unitary criterion of genetic divergence to delimit species.
Conflict of interest statement
Figures


References
-
- Mooers AO, Harvey PH (1994) Metabolic rate, generation time, and the rate of molecular evolution in birds. Mol Phylogenet Evol 3: 344–350. - PubMed
-
- Nunn GB, Stanley SE (1998) Body size effects and rates of cytochrome b evolution in tube-nosed seabirds. Mol Biol Evol 15: 1360–1371. - PubMed
-
- Laird CD, McConaughty BL, McCarthy BJ (1969) Rate of fixation of nucleotide substitutions in evolution. Nature 224: 149–154. - PubMed
MeSH terms
Substances
LinkOut - more resources
Full Text Sources
Other Literature Sources
Medical

