Randomized Controlled Trial
. 2014 Feb 5;9(2):e87042.
doi: 10.1371/journal.pone.0087042. eCollection 2014.

Positive network assortativity of influenza vaccination at a high school: implications for outbreak risk and herd immunity

Affiliations
Randomized Controlled Trial

Positive network assortativity of influenza vaccination at a high school: implications for outbreak risk and herd immunity

Victoria C Barclay et al. PLoS One. .

Abstract

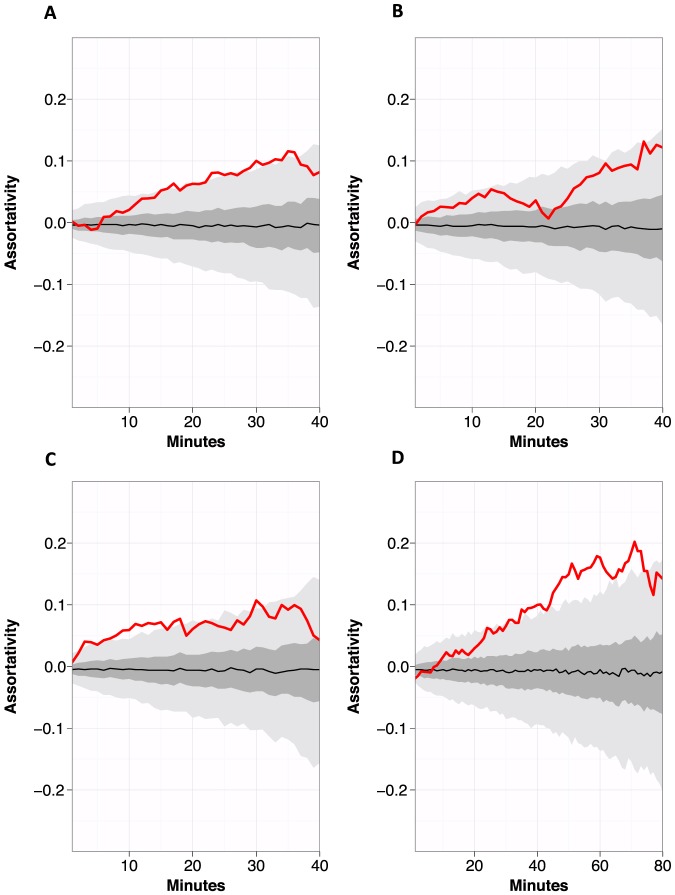
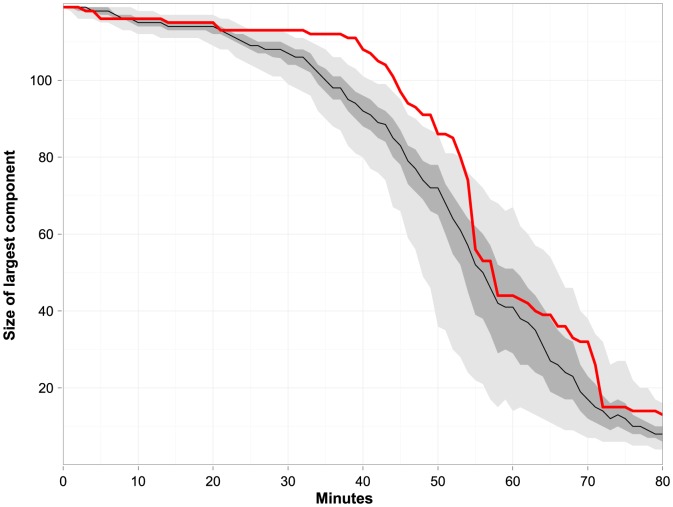
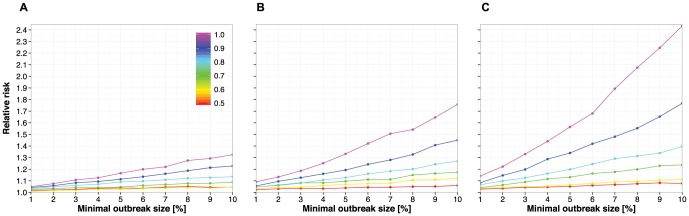
Schools are known to play a significant role in the spread of influenza. High vaccination coverage can reduce infectious disease spread within schools and the wider community through vaccine-induced immunity in vaccinated individuals and through the indirect effects afforded by herd immunity. In general, herd immunity is greatest when vaccination coverage is highest, but clusters of unvaccinated individuals can reduce herd immunity. Here, we empirically assess the extent of such clustering by measuring whether vaccinated individuals are randomly distributed or demonstrate positive assortativity across a United States high school contact network. Using computational models based on these empirical measurements, we further assess the impact of assortativity on influenza disease dynamics. We found that the contact network was positively assortative with respect to influenza vaccination: unvaccinated individuals tended to be in contact more often with other unvaccinated individuals than with vaccinated individuals, and these effects were most pronounced when we analyzed contact data collected over multiple days. Of note, unvaccinated males contributed substantially more than unvaccinated females towards the measured positive vaccination assortativity. Influenza simulation models using a positively assortative network resulted in larger average outbreak size, and outbreaks were more likely, compared to an otherwise identical network where vaccinated individuals were not clustered. These findings highlight the importance of understanding and addressing heterogeneities in seasonal influenza vaccine uptake for prevention of large, protracted school-based outbreaks of influenza, in addition to continued efforts to increase overall vaccine coverage.


Conflict of interest statement

Competing Interests: The authors have declared that no competing interests exist.

Figures

Figure 1
Figure 1. Network statistics on the combined contact data collected during all three school days, for the entire contact graph (orange line) and for the unvaccinated contact graph (blue line).
All statistics are calculated for a minimum contact duration (in minutes). As contact duration increases, nodes drop out of the network if they do not have a contact that satisfies the minimum contact duration. (A) Hence, the reduction in the number, V, of nodes. (B) Density of the graph. (C) Average (av.) degree. (D) Number of edges, E. (E) Maximum (max) cluster size, as a fraction of total (maximum) network size. (F) Transitivity (i.e., cluster coefficient). (G) Average (Av.) strength as defined by Barrat , where the strength of the node is the total number of CPRs of the node. (H) CV2 of degree. (I) Average (Av.) path length. (J) Modularity, Q, as defined by Reichardt and Bornholdt .
Figure 2
Figure 2. Calculated assortativity coefficient with respect to influenza vaccination status for a minimum contact duration in minutes: (A) on the first day of contact data collection; (B) on the second day of contact data collection; (C) on the third day of contact data collection; (D) on the combined contact data from days 1, 2, and 3.
In each panel, the red line represents the assortativity coefficient of the measured network and the black line represents the median assortativity coefficient where vaccination status was randomly allocated to nodes in the network. The dark gray area covers the range from the first to the third quartile of the random networks. The light gray area covers the range from the 2.5 to the 97.5 percentile of the random networks.
Figure 3
Figure 3. Size of the largest connected component: sub-network of non-vaccinated individuals.
The figure is based on the cumulative network of all three data collection days. The red line shows the empirical size of the largest component for a minimum contact duration in minutes. The black line shows the median size of the largest component for identical contact networks with random vaccination patterns for a minimum contact duration; the dark gray area covers the range from the first to the third quartile. The light gray area covers the range from the 2.5 to the 97.5 percentile.
Figure 4
Figure 4. Probability of disease outbreaks that involve at least a given fraction of the susceptible population for contact networks with positively assortative vaccination status relative to contact networks with randomly distributed vaccination status.
Networks were constructed by adding a vaccination status to all nodes of the contact network at 90 CPR that was measured at the high school in 2010. Simulations used 100 networks with randomly distributed vaccination status and 100 networks with positively assortative vaccination status (assortativity index r = 0.1 at 90 CPR). Relative risks of outbreaks (vertical axes) are defined as the ratio of the median of the vaccine assortative networks' outbreak probabilities to the median of the outbreak probabilities in random networks and are based on 10,000 simulation runs for each network setting. Minimal outbreak size (horizontal axes) are defined as percent of the susceptible population, which is the number of unvaccinated individuals plus the number of vaccinated individuals times the complement of the assumed vaccine efficacy (1−VE). Thus, each point on the colored lines represents the difference in probability of a disease outbreak based on the ratios between randomly and positively assortative networks for a given minimal outbreak size, and for different vaccine efficacies of 0.5, 0.6, 0.7, 0.8, & 1.0, and assuming: (A) 40%, (B) 50%, and (C) 60% vaccination coverage.

References

    1. Chowell G, Miller MA, Viboud C (2008) Seasonal influenza in the United States, France, and Australia: transmission and prospects for control. Epidemiol Infect 136: 852–864 10.1017/S0950268807009144 - DOI - PMC - PubMed
    1. Heymann A, Chodick G, Reichman B, Kokia E, Laufer J (2004) Influence of school closure on the incidence of viral respiratory diseases among children and on health care utilization. Pediatr Infect Dis J 23: 675–677 10.1097/01.inf.0000128778.54105.06 - DOI - PubMed
    1. Hens N, Ayele GM, Goeyvaerts N, Aerts M, Mossong J, et al. (2009) Estimating the impact of school closure on social mixing behaviour and the transmission of close contact infections in eight European countries. BMC Infect. Dis 9: 187 10.1186/1471-2334-9-1874 - DOI - PMC - PubMed
    1. Cauchemez S, Valleron A-J, Boelle P-Y, Flahault A, Ferguson NM (2008) Estimating the impact of school closure on influenza transmission from Sentinel data. Nature 452: 750–754 10.1038/nature06732 - DOI - PubMed
    1. Mossong J, Hens N, Jit M, Beutels P, Auranen K, et al. (2008) Social contacts and mixing patterns relevant to the spread of infectious diseases. PLoS Med 5: e74 10.1371/journal.pmed.0050074 - DOI - PMC - PubMed

Publication types