. 2013;16(Pt 1):679-86.
doi: 10.1007/978-3-642-40811-3_85.

Tensor metrics and charged containers for 3D Q-space sample distribution

Affiliations

Tensor metrics and charged containers for 3D Q-space sample distribution

Hans Knutsson et al. Med Image Comput Comput Assist Interv. 2013.

Abstract

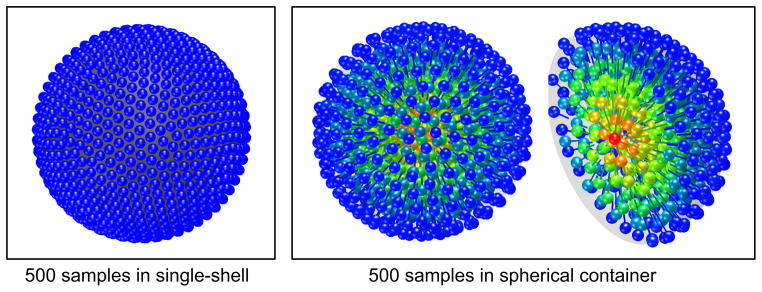
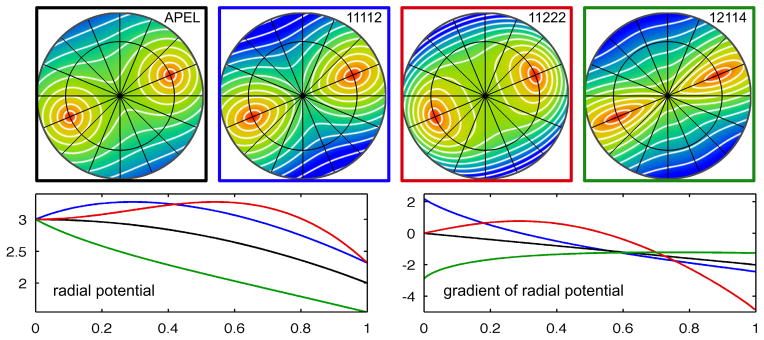
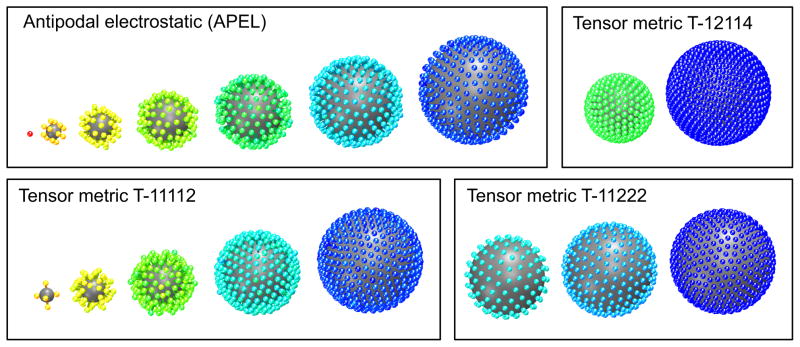
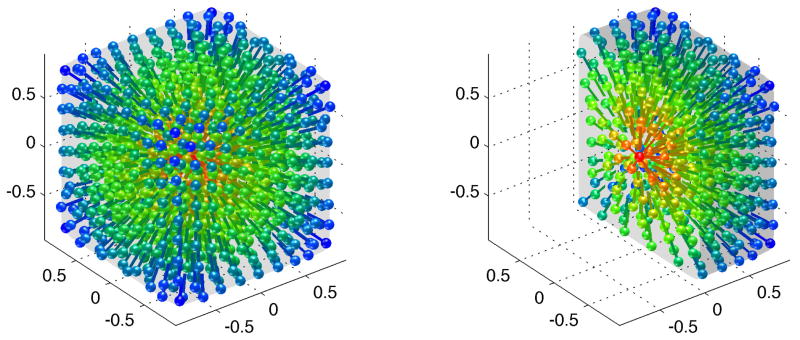
This paper extends Jones' popular electrostatic repulsion based algorithm for distribution of single-shell Q-space samples in two fundamental ways. The first alleviates the single-shell requirement enabling full Q-space sampling. Such an extension is not immediately obvious since it requires distributing samples evenly in 3 dimensions. The extension is as elegant as it is simple: Add a container volume of the desired shape having a constant charge density and a total charge equal to the negative of the sum of the moving point charges. Results for spherical and cubic charge containers are given. The second extension concerns the way distances between sample point are measured. The Q-space samples represent orientation, rather than direction and it would seem appropriate to use a metric that reflects this fact, e.g. a tensor metric. To this end we present a means to employ a generalized metric in the optimization. Minimizing the energy will result in a 3-dimensional distribution of point charges that is uniform in the terms of the specified metric. The radically different distributions generated using different metrics pinpoints a fundamental question: Is there an inherent optimal metric for Q-space sampling? Our work provides a versatile tool to explore the role of different metrics and we believe it will be an important contribution to further the continuing debate and research on the matter.


Figures

Fig. 1
Fig. 1
Results from optimization of a 500 sample positions in Q-space. Classic Jones single-shell electrostatic repulsion (left). Electrostatic forces with spherical container (right). The rightmost plot shows only half of the sphere to display the interior sampling. Colors indicate distance to the container center, Red = 0, Blue = 1.
Fig. 2
Fig. 2
Four distance maps generated by the metrics used in the experiments (top). The plots show distances from a reference point positioned at the center of the red area. Due to symmetry the 3D distance map is rotation invariant, i.e. the distance maps on any plane through the origin and the reference point are identical. The white lines are iso-distance lines (iso-surfaces in 3D). Note the variation in radial/angular metric ratio around the reference point, this ratio links strongly to the shell forming behavior shown in figure 3. The colored curves show container potentials (lower left) and the corresponding gradients (lower right) as a function of radius for the same four metrics. The curves have the same color as the frame of the corresponding distance map: APEL (black), T-11112 (blue), T-11222 (red) and T-12114 (green).
Fig. 3
Fig. 3
Four examples of the forming of shells that occur using the charged container approach. The shells have been segmented and are shown separately from the center out, left to right. The color indicate sample radius. The upper left result is also shown in a non-segmented version in figure 1 right. All examples have 500 sample points. The plots clearly show that the different metrics gives rise to radically different sample distributions and shell forming behavior. Intuitively it makes sense that if the ratio angular/radial distance increases (see figure 2), i.e. the surface area of a sphere increases relative to it’s radius, fewer shells with more samples in each will be formed.
Fig. 4
Fig. 4
Plots displaying different features of the optimization of a 500 sample point distribution using the antipodal electrostatic metric (APEL). Histogram of number of samples vs radius, the forming of shells is clearly visible (top left). Histogram of samples vs distance to closest neighbors, the narrow peak shows that the distribution is highly uniform in Q-space (top right). Histogram of samples vs radius after the shells have been forced to become radially thin (bottom left). The 10-logarithm of the system energy vs number of iterations for two separate optimization runs (bottom right). The blue curve shows a typical run. The red curve shows a run where a gradually increasing extra force was applied to produce thin shells. Note that the end results has more than 4 orders of magnitude higher energy which shows that adding a ‘shelling’ forming force will produce precise shells but will increase the system energy considerably, i.e. the ‘soft’ shells provide a more even sample distribution.
Fig. 5
Fig. 5
Optimization result using a cubic charge container and the antipodal electrostatic metric (APEL). The rightmost plot shows only half of the cube to display the interior sampling.

References

    1. Assaf Y, Freidlin RZ, Rohde GK, Basser PJ. New modeling and experimental framework to characterize hindered and restricted water diffusion in brain white matter. Magn Reson Med. 2004;52(5):965–978. - PubMed
    1. Wu YC, Alexander AL. Hybrid diffusion imaging. Neuroimage. 2007;36(3):617–629. - PMC - PubMed
    1. Alexander DC. A general framework for experiment design in diffusion MRI and its application in measuring direct tissue-microstructure features. Magn Reson Med. 2008;60(2):439–448. - PubMed
    1. Westin CF, Pasternak O, Knutsson H. Rotationally invariant gradient schemes for diffusion MRI. Proc of the ISMRM Annual Meeting (ISMRM 2012) 2012:3537.
    1. Jones DK, Simmons A, Williams SCR, Horsfield MA. Non-invasive assessment of axonal fiber connectivity in the human brain via diffusion tensor MRI. Magn Reson Med. 1999;42:37–41. - PubMed

Publication types

MeSH terms

LinkOut - more resources