

EM reconstruction of dual isotope PET using staggered injections and prompt gamma positron emitters
- PMID: 24506645
- PMCID: PMC3987693
- DOI: 10.1118/1.4861714
EM reconstruction of dual isotope PET using staggered injections and prompt gamma positron emitters
Abstract
Purpose: The aim of dual isotope positron emission tomography (DIPET) is to create two separate images of two coinjected PET radiotracers. DIPET shortens the duration of the study, reduces patient discomfort, and produces perfectly coregistered images compared to the case when two radiotracers would be imaged independently (sequential PET studies). Reconstruction of data from such simultaneous acquisition of two PET radiotracers is difficult because positron decay of any isotope creates only 511 keV photons; therefore, the isotopes cannot be differentiated based on the detected energy.
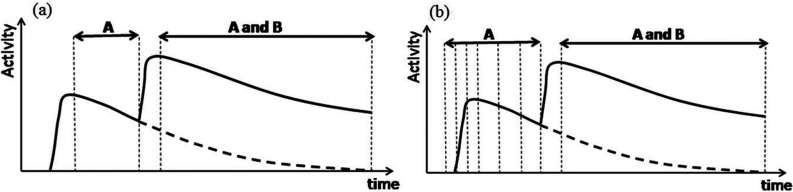
Methods: Recently, the authors have proposed a DIPET technique that uses a combination of radiotracer A which is a pure positron emitter (such as(18)F or (11)C) and radiotracer B in which positron decay is accompanied by the emission of a high-energy (HE) prompt gamma (such as (38)K or (60)Cu). Events that are detected as triple coincidences of HE gammas with the corresponding two 511 keV photons allow the authors to identify the lines-of-response (LORs) of isotope B. These LORs are used to separate the two intertwined distributions, using a dedicated image reconstruction algorithm. In this work the authors propose a new version of the DIPET EM-based reconstruction algorithm that allows the authors to include an additional, independent estimate of radiotracer A distribution which may be obtained if radioisotopes are administered using a staggered injections method. In this work the method is tested on simple simulations of static PET acquisitions.
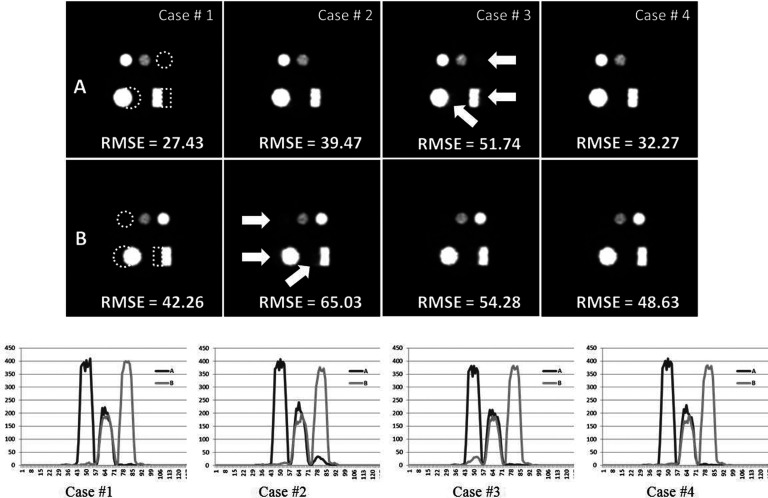
Results: The authors' experiments performed using Monte-Carlo simulations with static acquisitions demonstrate that the combined method provides better results (crosstalk errors decrease by up to 50%) than the positron-gamma DIPET method or staggered injections alone.
Conclusions: The authors demonstrate that the authors' new EM algorithm which combines information from triple coincidences with prompt gammas and staggered injections improves the accuracy of DIPET reconstructions for static acquisitions so they reach almost the benchmark level calculated for perfectly separated tracers.
Figures


Similar articles
-
Dual-isotope PET using positron-gamma emitters.Phys Med Biol. 2011 Jul 21;56(14):4539-56. doi: 10.1088/0031-9155/56/14/020. Epub 2011 Jul 1. Phys Med Biol. 2011. PMID: 21725143
-
Simulation of triple coincidences in PET.Phys Med Biol. 2015 Jan 7;60(1):117-36. doi: 10.1088/0031-9155/60/1/117. Epub 2014 Dec 5. Phys Med Biol. 2015. PMID: 25479147
-
Recovering the triple coincidence of non-pure positron emitters in preclinical PET.Phys Med Biol. 2016 Mar 7;61(5):1904-31. doi: 10.1088/0031-9155/61/5/1904. Epub 2016 Feb 15. Phys Med Biol. 2016. PMID: 26878420
-
Quantitative imaging of 124I and 86Y with PET.Eur J Nucl Med Mol Imaging. 2011 May;38 Suppl 1(Suppl 1):S10-8. doi: 10.1007/s00259-011-1768-2. Epub 2011 Apr 12. Eur J Nucl Med Mol Imaging. 2011. PMID: 21484385 Free PMC article. Review.
-
Physics of pure and non-pure positron emitters for PET: a review and a discussion.EJNMMI Phys. 2016 Dec;3(1):8. doi: 10.1186/s40658-016-0144-5. Epub 2016 May 23. EJNMMI Phys. 2016. PMID: 27271304 Free PMC article. Review.
Cited by
-
Multiplexed imaging of radionuclides.Nat Biomed Eng. 2025 Jul;9(7):993-1006. doi: 10.1038/s41551-025-01406-8. Epub 2025 Jun 20. Nat Biomed Eng. 2025. PMID: 40542108 Free PMC article. Review.
-
Update on novel trends in PET/CT technology and its clinical applications.Br J Radiol. 2018 Jan;91(1081):20160534. doi: 10.1259/bjr.20160534. Epub 2016 Nov 25. Br J Radiol. 2018. PMID: 27730823 Free PMC article. Review.
-
PET Parametric Imaging: Past, Present, and Future.IEEE Trans Radiat Plasma Med Sci. 2020 Nov;4(6):663-675. doi: 10.1109/trpms.2020.3025086. Epub 2020 Sep 21. IEEE Trans Radiat Plasma Med Sci. 2020. PMID: 33763624 Free PMC article.
-
Simultaneous quantitative imaging of two PET radiotracers via the detection of positron-electron annihilation and prompt gamma emissions.Nat Biomed Eng. 2023 Aug;7(8):1028-1039. doi: 10.1038/s41551-023-01060-y. Epub 2023 Jul 3. Nat Biomed Eng. 2023. PMID: 37400715 Free PMC article.
References
-
- Huang S. C., Carson R. E., Hoffman E. J., Kuhl D. E., and Phelps M. E., “An investigation of a double-tracer technique for positron computerized tomography,” J. Nucl. Med. 23, 816–822 (1982). - PubMed
-
- Kadrmas D. J. and Rust T. C., “Feasibility of rapid multitracer PET tumor imaging,” IEEE Trans. Nucl. Sci. 51, 2664–2668 (2004).10.1109/NSSMIC.2004.1462799 - DOI
Publication types
MeSH terms
Substances
Grants and funding
LinkOut - more resources
Full Text Sources
Other Literature Sources
