

Hypoxic regulation of glutamine metabolism through HIF1 and SIAH2 supports lipid synthesis that is necessary for tumor growth
- PMID: 24506869
- PMCID: PMC3920584
- DOI: 10.1016/j.cmet.2013.11.022
Hypoxic regulation of glutamine metabolism through HIF1 and SIAH2 supports lipid synthesis that is necessary for tumor growth
Abstract
Recent reports have identified a phenomenon by which hypoxia shifts glutamine metabolism from oxidation to reductive carboxylation. We now identify the mechanism by which HIF-1 activation results in a dramatic reduction in the activity of the key mitochondrial enzyme complex α ketoglutarate dehydrogenase (αKGDH). HIF-1 activation promotes SIAH2 targeted ubiquitination and proteolysis of the 48 kDa splice variant of the E1 subunit of the αKGDH complex (OGDH2). Knockdown of SIAH2 or mutation of the ubiquitinated lysine residue on OGDH2 (336KA) reverses the hypoxic drop in αKGDH activity, stimulates glutamine oxidation, and reduces glutamine-dependent lipid synthesis. 336KA OGDH2-expressing cells require exogenous lipids or citrate for growth in hypoxia in vitro and fail to grow as model tumors in immunodeficient mice. Reversal of hypoxic mitochondrial function may provide a target for the development of next-generation anticancer agents targeting tumor metabolism.
Copyright © 2014 Elsevier Inc. All rights reserved.
Figures
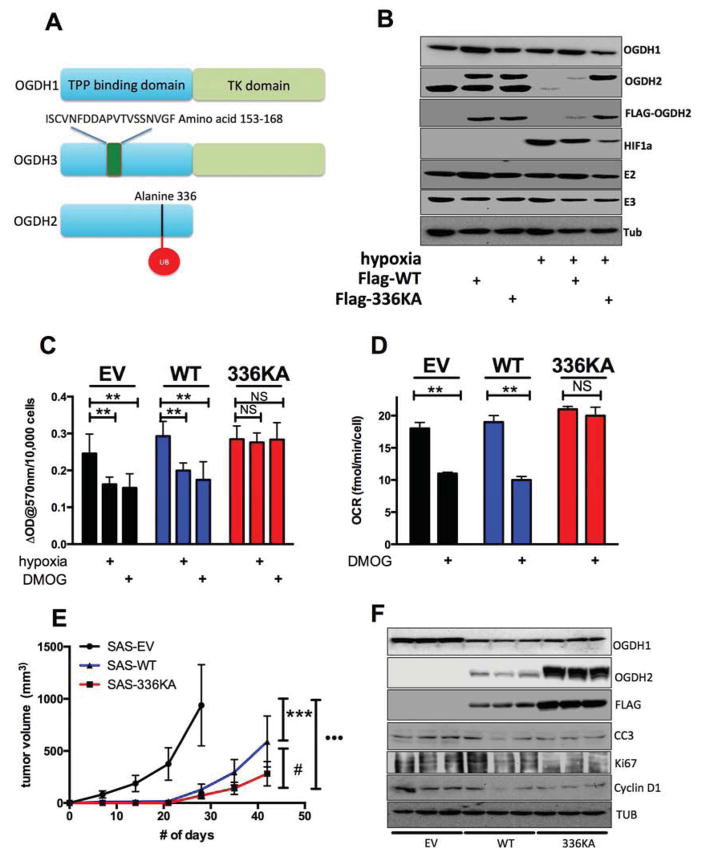
 ). OGDH2 is identical to OGDH1 until aa 403. Panel B. Western blot of lysates from SAS cells stably expressing empty vector, Flag-WT OGDH2 and Flag-336KA OGDH2 exposed to normoxia or 0.5% oxygen for 16h. Lysates were probed for proteins as indicated. Note both anti-Flag and anti-OGDH2 antibodies show OGDH2 336KA is resistant to hypoxic degradation. Panel C. αKGDH activity in SAS cell lines described in B, treated with either control, 16h 500μM DMOG, or 0.5% oxygen. Panel D. Mitochondrial OCR in SAS cell lines described in B treated with either control, 500μM DMOG, or 0.5% oxygen and measured in glutamine-only media. Panel E. Tumor volume of SAS cells expressing empty vector, OGDH-WT and OGDH-336KA grown in nude mice (n=8–10/group). Statistically significant growth differences exist between all three groups. Panel F. Western blot analysis of lysates of tumors harvested after growth as described in E. Note decrease in markers of proliferation as tumors grow more slowly. Data from c and d are mean ± S.D and tumor volumes are mean ± S.E.
References
-
- Denko NC. Hypoxia, HIF1 and glucose metabolism in the solid tumour. Nature Reviews Cancer. 2008;8:705–713. - PubMed
-
- Epstein AC, Gleadle JM, McNeill LA, Hewitson KS, O’Rourke J, Mole DR, Mukherji M, Metzen E, Wilson MI, Dhanda A, et al. C. elegans EGL-9 and mammalian homologs define a family of dioxygenases that regulate HIF by prolyl hydroxylation. Cell. 2001;107:43–54. - PubMed
Publication types
MeSH terms
Substances
Grants and funding
LinkOut - more resources
Full Text Sources
Other Literature Sources
